How to Screen Forex Pairs: A Practical Guide
Forex punishes a habit that works fine everywhere else.
In most markets, you can run a performance screen, read the top of the list, and treat each result as a separate opportunity. Do that in forex and you'll end up with five versions of the same trade, convinced you've found five setups.
The reason is structural, and once you see it, forex screening gets a lot easier. This guide covers why currency pairs behave differently from other instruments, how to read a screen without double-counting, which screen suits which situation, and how session timing changes what your results mean.
If you're new to screening generally, the guide to market screening covers the fundamentals first.
Why Forex Screening Works Differently
Three things separate forex from every other asset class you might screen.
A pair is a ratio, not a thing. EURUSD isn't an instrument in the way gold or the S&P 500 is. It's the price of one currency measured in another, so when it rises, at least three explanations fit: the euro strengthened, the dollar weakened, or both moved and the euro moved harder. The number on your screen doesn't distinguish between them.
This matters because your screen contains the same currencies over and over. Every major pair contains the dollar. Every EUR cross contains the euro. A ranked list of pairs isn't a list of independent instruments, it's a list of overlapping combinations, and the overlap is where traders get fooled.
There's no central exchange. Forex trades over the counter across a network of banks and brokers, so no single venue sees the whole market. That's why forex screens work on price rather than volume: performance, structure, levels, and momentum. It sounds like a limitation and mostly isn't, because price in a market this liquid already reflects participation reasonably well.
It runs continuously through the week. From Sunday evening to Friday evening there's no close, but there is structure. The Asian, European, and North American sessions have distinct personalities, and a move that happened in one means something different from the same move in another. Your screen doesn't know which session produced a result. You do, and that knowledge does a lot of the work volume would do elsewhere.
Reading a Correlated Result
Here's the skill that separates traders who get value from forex screening from those who don't.
Here's a real example. Run a performance screen on the daily timeframe, and the gainers tab opens with AUDUSD, NZDUSD, EURUSD, and GBPUSD,
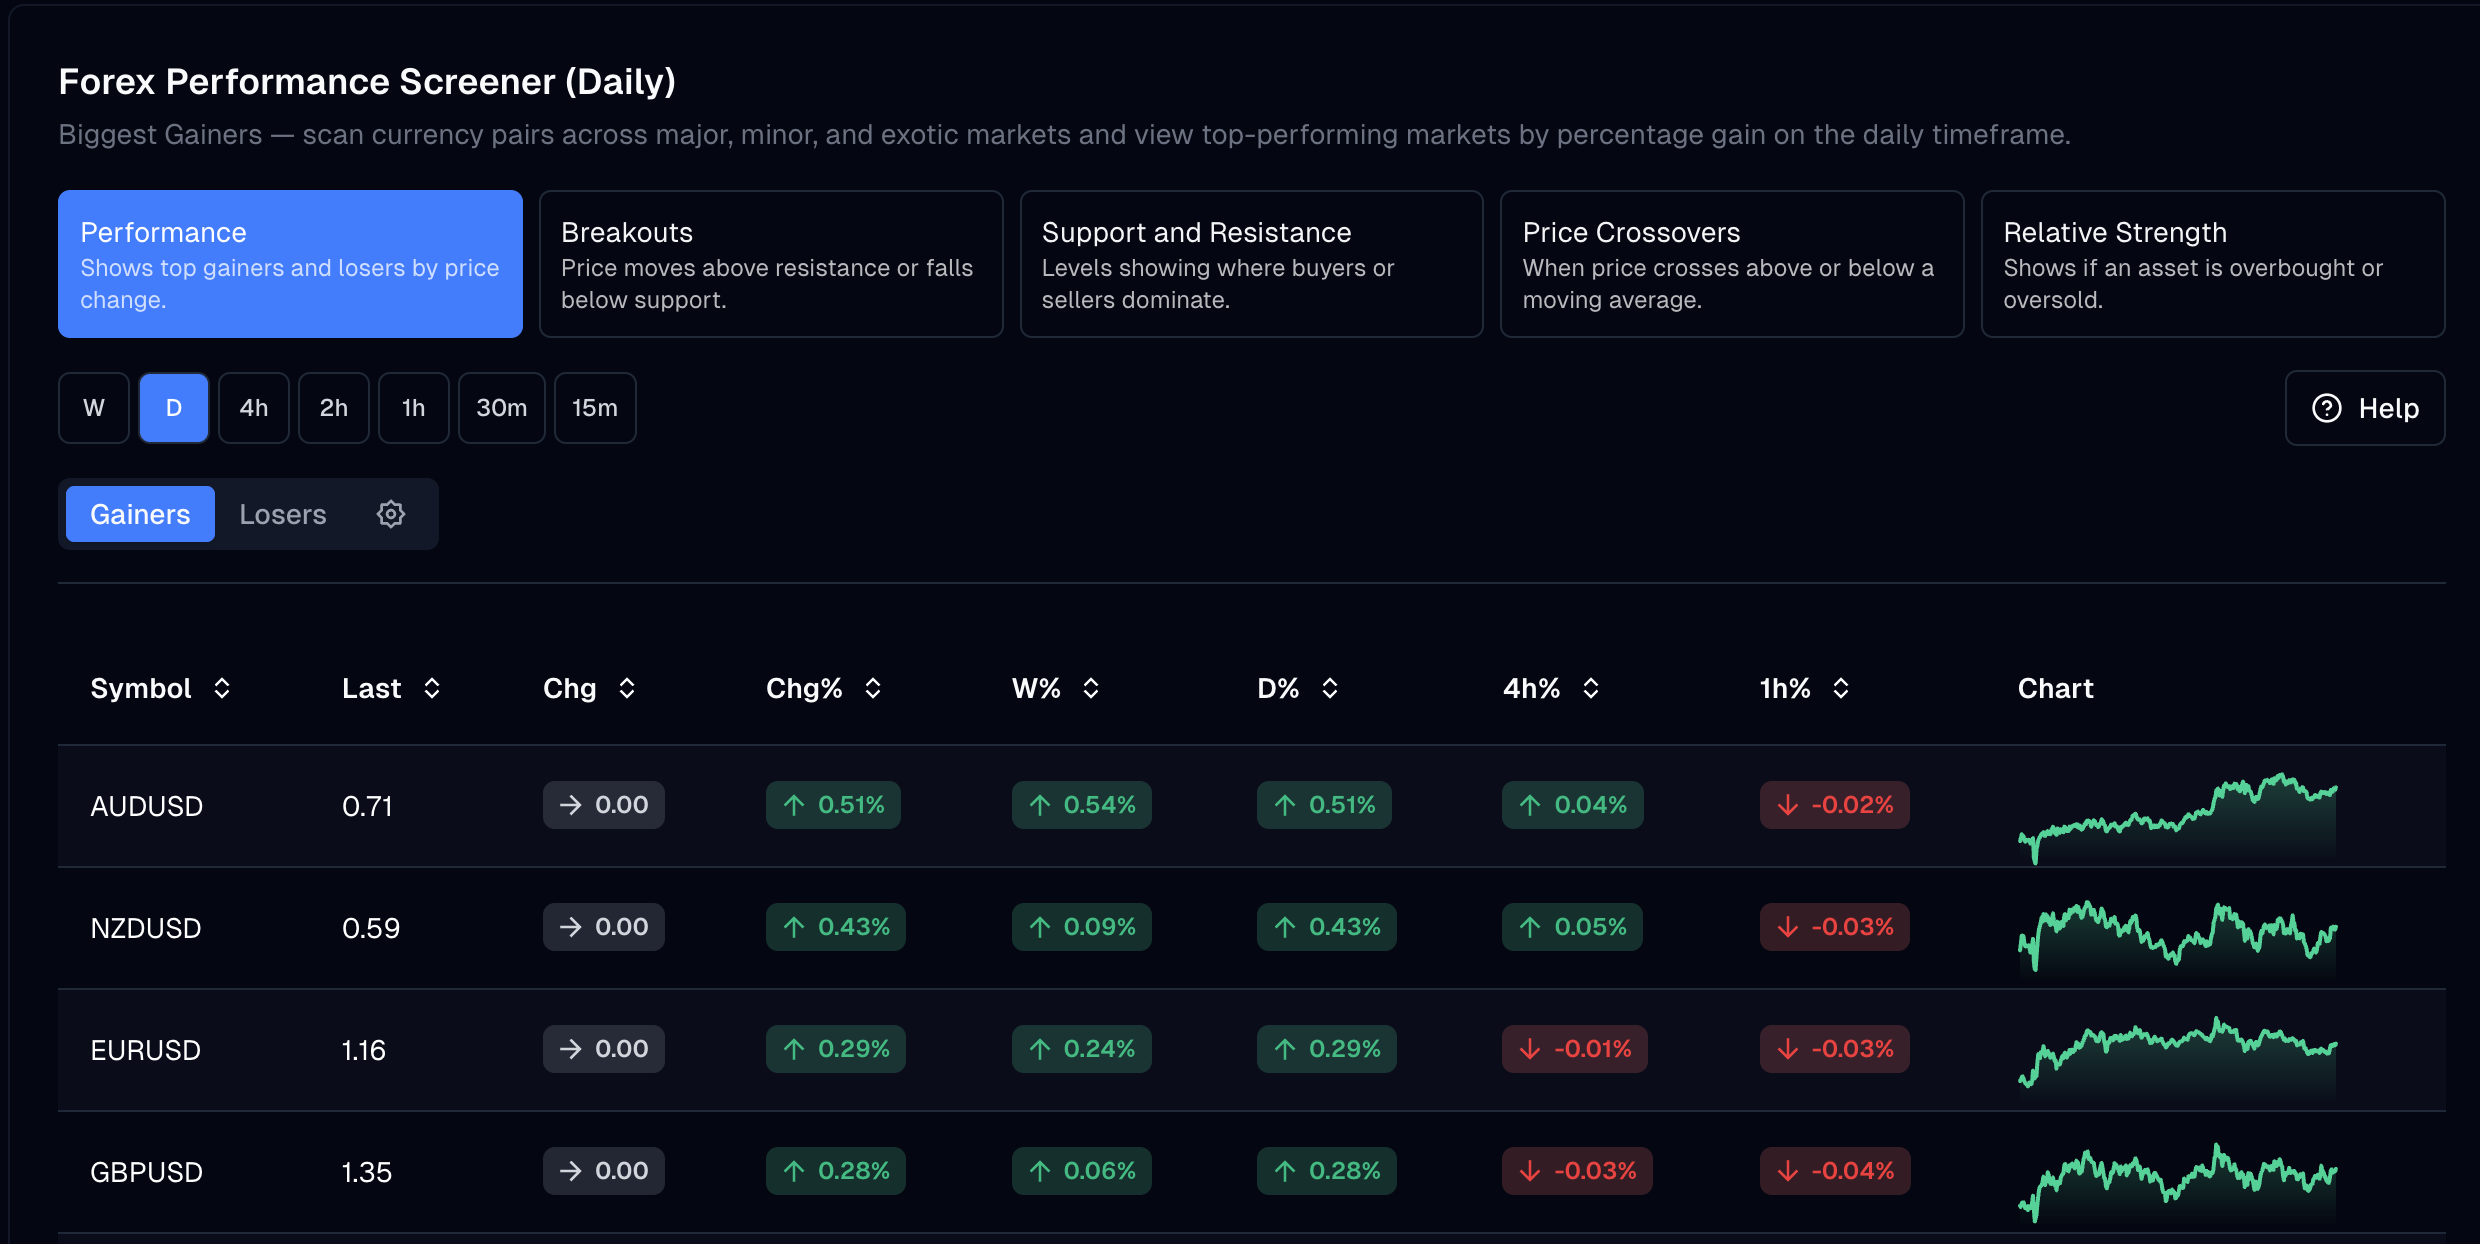
while the losers tab leads with USDCHF, USDCAD, and USDJPY.
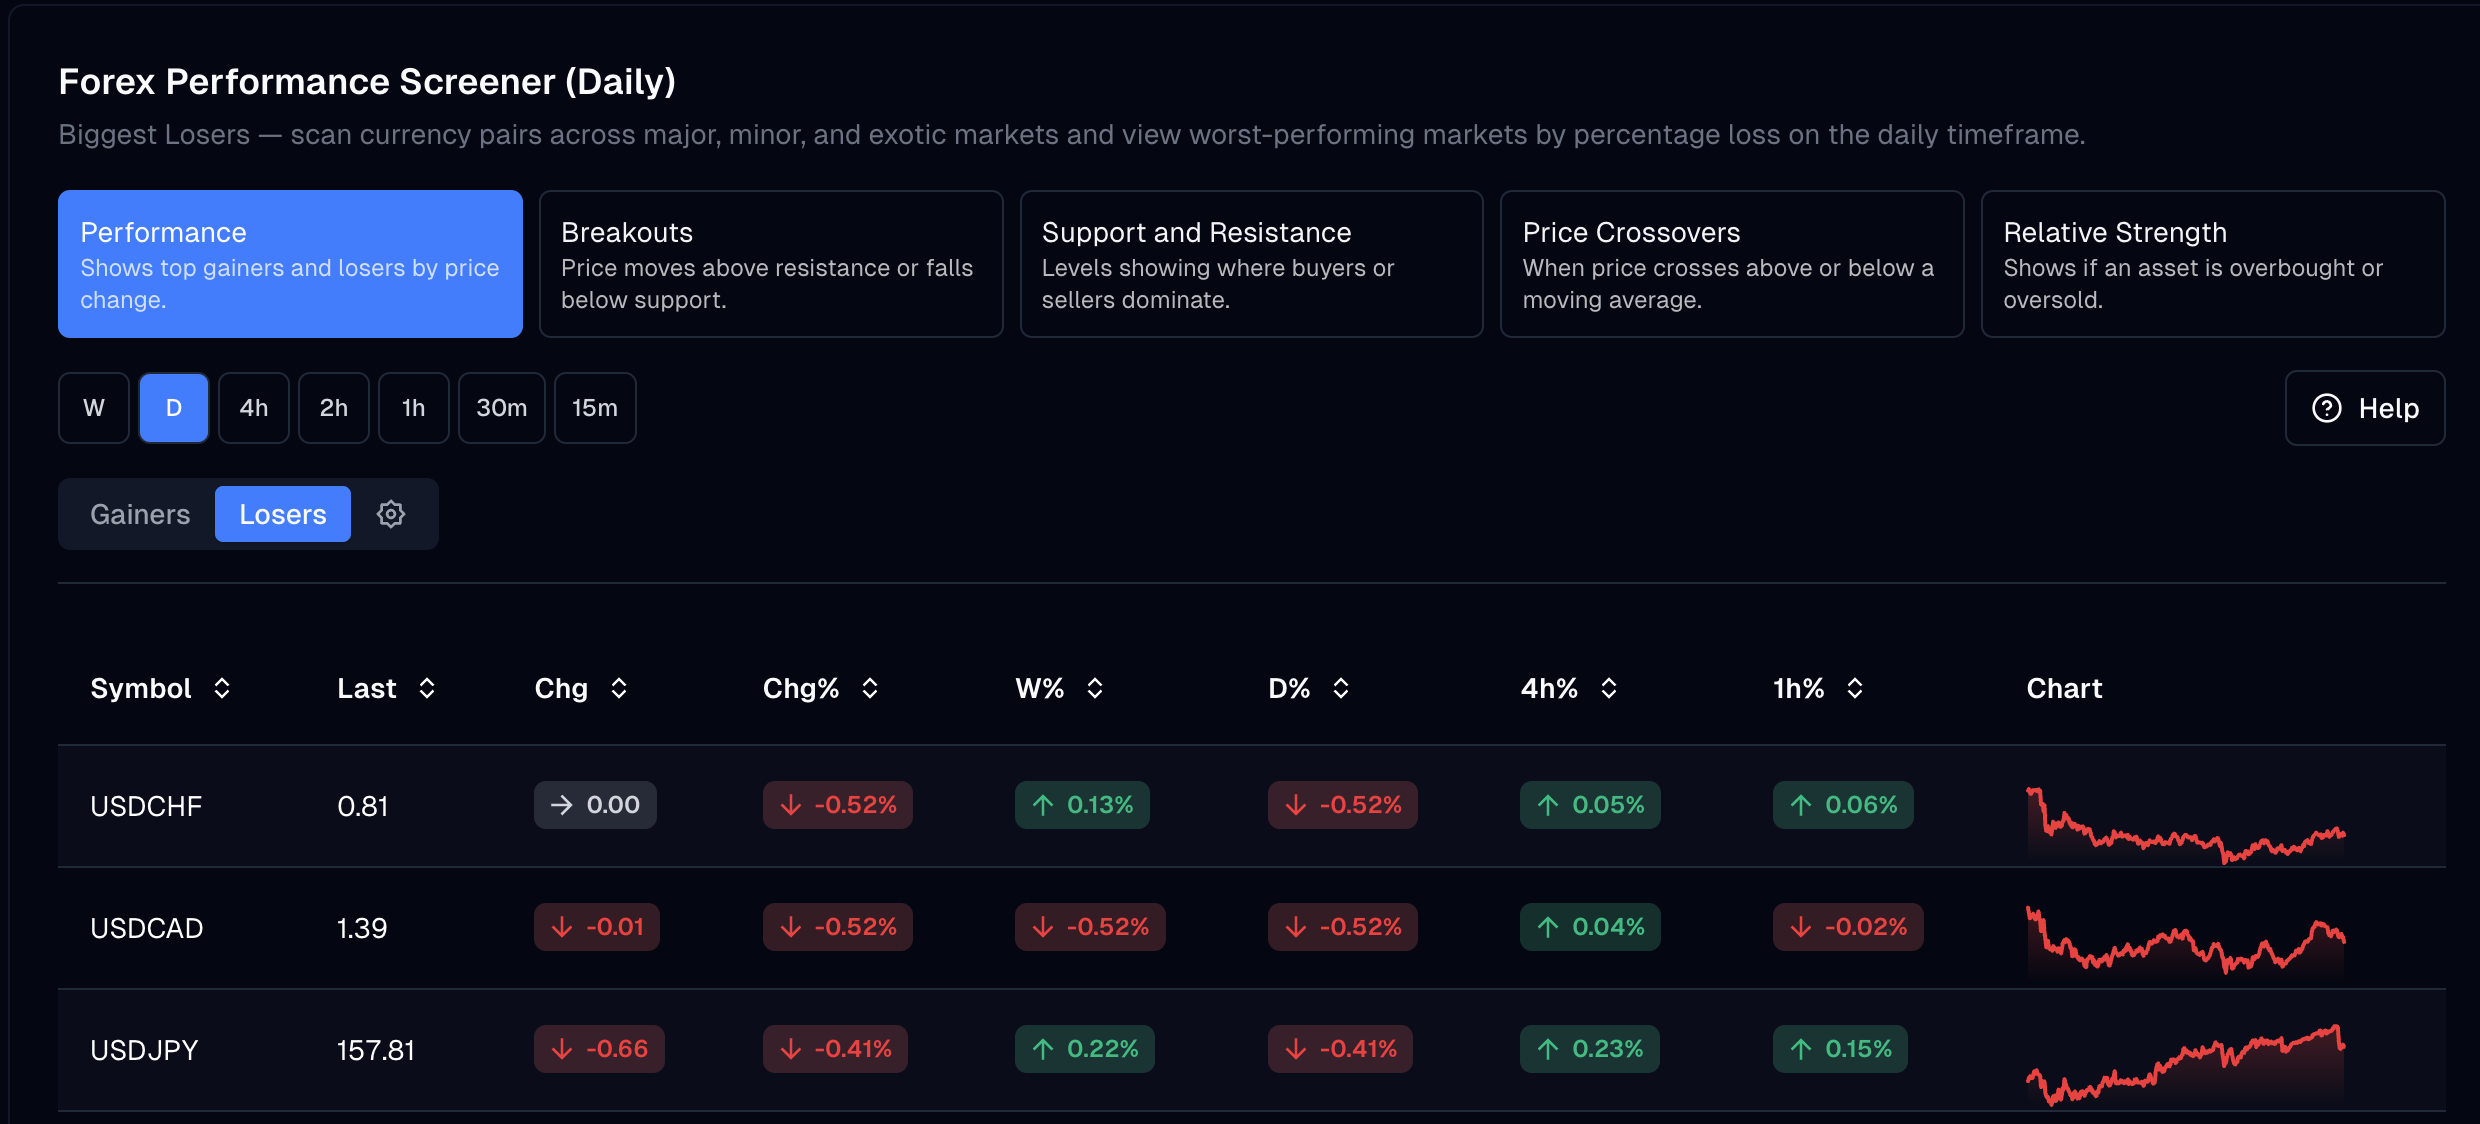
That looks like seven results. It's one. The dollar weakened, and every pair on those two lists is reporting the same event from a different angle. The gainers all have USD as the quote currency, so dollar weakness pushes them up. The losers all have USD as the base currency, so the same weakness pushes them down. Nothing else is happening.
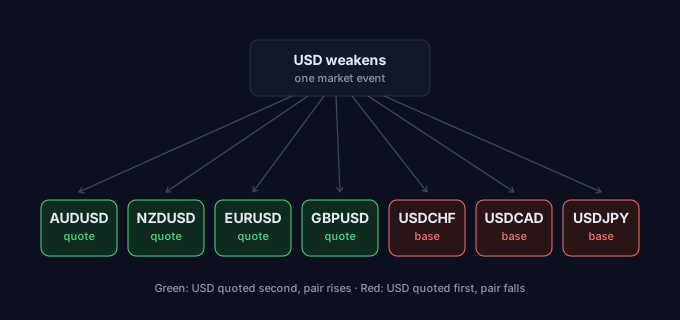
Reading this correctly changes what you do next. Instead of taking several positions that will all win or lose together, you're looking at one macro view with several possible expressions, and your job is picking the cleanest one. Usually that means whichever pair has the best structure: the one breaking out, the one at a level, the one where the other currency is also cooperating.
The quick check. Read the gainers and losers tabs together, not separately, and ask which currency appears most often and on which side of the pair. If one currency is the quote in most of your gainers and the base in most of your losers, you're looking at a single story about that currency. If your gainers have no currency in common, the moves are genuinely independent, which is less usual and usually more interesting.
Where it gets useful. The results worth the most attention are often the ones that break the pattern. If the dollar is broadly weak but one USD pair is flat or moving the wrong way, something specific is happening to the other currency, and that's a setup nobody found by watching EURUSD.
Crosses help here too. Pairs without the dollar, like EURGBP, AUDNZD, or GBPJPY, isolate the relationship between two non-dollar currencies. When a cross ranks highly on a day the dollar is quiet, it's telling you something the majors can't.
Which Screen for Which Situation
The five screeners answer different questions. In forex specifically, here's when each earns its place.
Performance is the orientation screen. Run it first, on the daily, to establish what's actually moving before you look at anything else. Its main job in forex isn't finding trades directly, it's telling you which currency is driving the day so you can read everything else in context.
Breakouts suits forex well, because currency pairs range for extended stretches and then resolve. The breakouts screen is most useful on the daily and 4h, where a break has enough behind it to mean something. On 15m you'll get constant noise, since pairs cross short-term levels dozens of times a session.
Support and resistance is the one traders underuse. It finds pairs approaching a level rather than breaking it, which gives you time to prepare instead of chasing. In a market that ranges as much as forex does, knowing what's about to be tested is often worth more than knowing what already broke.
Price crossovers work best on higher timeframes here. Forex trends develop gradually, so a daily or weekly crossover carries information that a 15m crossover doesn't. Treat these as trend-context signals rather than entries.
Relative strength uses RSI to flag overbought and oversold readings. It's particularly useful in forex because pairs mean-revert more than trending instruments do, so extended readings resolve more often than they persist. Worth knowing that "relative strength" here means the RSI indicator, not comparing one pair against another.
Combining them is where the value is. A pair at the top of the performance list that's also breaking out is a stronger case than either alone. A pair showing overbought while approaching resistance is a different setup from either signal in isolation. Run one screen, note what surfaces, then check those names against a second screen.
Timeframes and Sessions
Timeframe selection in forex isn't just about how long you hold. It interacts with the session structure in ways worth understanding.
A daily candle in forex spans all three sessions, so a daily result tells you the net outcome of roughly 24 hours of very different market conditions. That's useful for direction and useless for understanding how the move happened.
Dropping to 4h splits the day into session-sized chunks, which is why it's a good default for most forex screening. A 4h result usually corresponds to something that happened within one session, so it's interpretable in a way a daily result isn't.
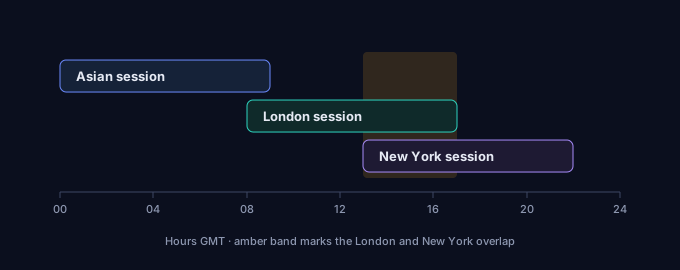
Below 1h, session context dominates. The same criteria produce very different results depending on when you run them. During the London and New York overlap, roughly 8am to noon Eastern, most pairs are active and results are dense. During the gap between the New York close and the Tokyo open, activity thins considerably and a screen will surface moves that are technically real and practically untradeable on spread alone.
A practical routine: check the daily for direction, the 4h for setups, and drop lower only for timing on something you've already decided to trade. Running the same screen across several timeframes and comparing the columns tells you whether a move is building or fading, which one view can't.
A Worked Example
Say you're screening at the start of the London session.
Start with performance on the daily. Read the top five and the bottom five together, and identify the dominant currency. Suppose JPY appears as the weak side across several pairs. That's your context for everything that follows.
Switch to breakouts, still on the daily. You're not looking for anything now, you're looking for JPY pairs specifically, because a breakout that aligns with the currency story is stronger than one that doesn't. If GBPJPY appears in the breakouts list and JPY weakness is your context, those two facts reinforce each other.
Now check relative strength on the same pair. If it's already deep into overbought territory, the move may be extended rather than starting, which is a reason to wait for a pullback rather than enter. If RSI is mid-range, there's more room.
Drop to 4h to see whether the move is accelerating or fading. Compare the 4h and 1h columns against the daily. Consistent positive readings across all three suggest sustained momentum. A strong daily with weak recent readings suggests the move already happened.
Then open the chart. Everything up to this point narrowed a market of dozens of pairs to one name and gave you context for reading it. It didn't tell you where to enter, what to risk, or when to exit. That part is still yours.
Common Mistakes in Forex Screening
Taking correlated results as separate trades. Covered above, and it's the expensive one. Five dollar pairs is one position sized five times.
Screening too low for your holding period. A 15m screen produces results constantly, and in forex most of them won't survive the spread. If you hold for days, screen on the daily and 4h.
Ignoring the session. A breakout at 3am Eastern on thin liquidity and the same breakout during the London overlap are not the same event, and screens display them identically.
Expecting volume. There isn't a centralised figure to screen on. Traders arriving from equities often look for it, conclude the tool is incomplete, and miss that price structure does the job here.
Using one threshold across every market. Forex moves are small compared to crypto. Settings tuned elsewhere will return nothing here, or everything. Adjust when you switch markets.
Frequently Asked Questions
How many pairs should I screen at once? All of them, which is the point. Screening is what lets you cover majors, minors, and crosses without watching them. Narrowing your attention comes after the screen returns results, not before.
Why don't forex screens show volume? There's no central exchange in forex, so no authoritative volume figure exists. Screens use price-based conditions instead, and session timing covers much of what volume would tell you elsewhere.
What's the best timeframe for screening forex? 4h is a reasonable default because it roughly corresponds to session-sized moves. Use the daily for direction and lower timeframes only for timing an entry you've already committed to.
Should I screen majors or crosses? Both, and read them differently. Majors tell you about the dollar. Crosses isolate relationships between other currencies and often surface moves the majors hide.
Does screening work during the Asian session? Yes, but expect fewer and smaller results, and be careful with pairs that are illiquid at that hour. JPY, AUD, and NZD pairs are the most active then.
Is a screen result a trade signal? No. It's a candidate that met your condition. Every result still needs chart review against your own entry criteria.
Start Screening
You can run any of these screens on the forex performance screener right now, across majors, minors, and crosses, with no signup required.
For the fundamentals behind these techniques, see the complete guide to market screening.