What Is Market Screening? A Practical Guide for Forex, Crypto, and Commodity Traders
Count what's available to you. Around 28 major and minor currency pairs. A few thousand crypto tokens worth trading. Dozens of global indices, commodities, and metals.
Now count what you actually watch. For most traders it's about eight.
The gap between those two numbers is where missed trades live. The pair that sat still for three weeks and broke out this morning wasn't hiding. It just wasn't on your screen, and by the time you heard about it, most of the move was gone.
Screening closes that gap. Instead of watching a few instruments and hoping the good one is among them, you describe what you're looking for and let the market point you at it.
This guide covers what screening is, how a screen is built, the main types of screen worth knowing, and how the job changes across forex, crypto, indices, commodities, and metals.
What Is Market Screening?
You give the system a condition. It checks every instrument in a market and returns only the ones that match. That's the whole idea.
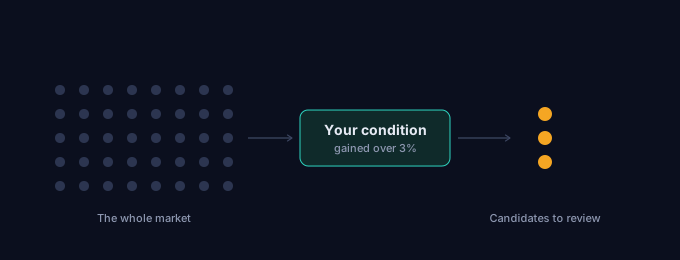
The condition can be as simple as which instruments gained the most today, or as specific as which ones just crossed above a moving average. Either way you get back a short, ranked list drawn from a pool too big to check by hand.
Three related terms are worth separating.
Scanning means the same thing as screening. Different platforms picked different words. You can treat them as the same.
Backtesting looks backward. A screen asks which instruments match right now. A backtest asks how a rule would have performed over the past year. One tests an idea, the other uses it.
Alerts watch something you already picked. A screen has no list to start with. It checks everything and hands you instruments you weren't watching. Alerts make you faster on what you know. Screening changes what you know.
Why Watchlists Fail Traders
Most traders start with a watchlist. Most watchlists stop working within a few months, and hardly anyone notices, because a watchlist doesn't fail loudly. It just gets less useful.
The first problem is that it's fixed and the market isn't. You built the list when certain things were moving. Months later, those pairs are quiet and the ones you deleted for being boring are the only ones worth trading. Your list doesn't know. Updating it means surveying the whole market again, which is the work the list was meant to save you.
The second problem is bias. People add what they already know: the majors, whatever trades in their own time zone, whatever moved hard enough to stick in memory. None of that has much to do with where opportunity actually is today.
The third is a ceiling. Attention doesn't scale. You can add rows forever, but the number you genuinely watch stays around eight. A list of forty is a list of eight plus thirty-two you glance at.
This isn't an argument against watchlists. A watchlist is a good place to keep an instrument once something has drawn your attention to it. The problem starts when it's also supposed to do the drawing.
The Anatomy of a Screen
Every screen is built from the same five choices.
| Component | The question it answers |
|---|---|
| Market | Which asset class am I looking at? |
| Screen type | What kind of condition am I looking for? |
| Timeframe | Over what period is it measured? |
| Settings | How strict should the thresholds be? |
| Output | How are the results ranked and read? |
Knowing these separately is what lets you fix a screen that returns nothing, or returns four hundred things, or returns results that look right and behave badly.
Market is the asset class you're screening: forex, crypto, indices, commodities, or metals. People rush past this, and it's a common reason a screen disappoints. The same condition applied to the wrong asset class returns noise.
Screen type is the kind of condition you're testing for. Momentum, breakouts, proximity to a key level, a moving average crossover, or an overbought and oversold reading. Each answers a different question, and picking the wrong one is like using the wrong search term.
Timeframe is the period your condition is measured over. The same screen gives completely different results depending on what you pick. Three percent in a day is nothing in crypto and a big move in forex. Traders often treat timeframe as a display setting. It isn't. Change it and you've asked a different question.
Settings control how strict the condition is. Loosen them and you get more results with more noise. Tighten them and you get fewer, higher-conviction ones, right up until you get none at all. Most screeners ship with sensible defaults, and leaving them alone until you understand the output is usually the right call.
Output is what comes back and in what order. Forty results sorted alphabetically is barely useful. Forty ranked by how strongly each one matched is a queue you can work down from the top.
These five come up throughout the rest of this guide. When a screen misbehaves, checking them in order is the fastest way to find the problem.
The Five Screen Types Worth Knowing
Most technical screening comes down to five questions. The thresholds change between markets. The questions don't.
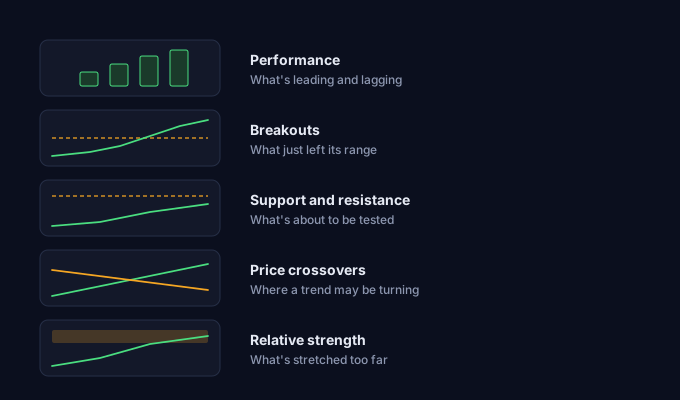
Performance ranks instruments by how much they've moved over your chosen period. It's the simplest screen there is and probably the most used, because it needs no interpretation. Everyone understands "up 4.2 percent since yesterday." It answers: what's leading, and what's lagging?
Breakouts find instruments pushing above resistance or below support. This is the closest screen to how most discretionary traders already think, and it's usually the second one people learn. It answers: what just left its range?
Support and resistance finds instruments approaching a significant level rather than breaking through it. The difference matters. Breakouts tell you what already happened. Proximity screens tell you what's about to be decided, which gives you time to prepare rather than react.
Price crossovers find instruments crossing above or below a moving average. These are trend-change signals, and they tend to suit swing traders more than day traders because a crossover on a short timeframe fires constantly.
Relative strength uses RSI to find overbought and oversold conditions. Worth flagging a naming quirk here: some traders use "relative strength" to mean comparing one instrument against another. In screening tools it almost always means the RSI indicator, measuring an instrument against its own recent range.
Run more than one of these on the same market and the overlap is where things get interesting. An instrument at the top of the performance list that's also breaking out is a stronger case than either signal alone.
How Screening Changes by Asset Class
The five components stay the same. What changes is what counts as a big move and how you should read the results.
Forex
A currency pair isn't a single thing. It's a ratio between two currencies. When EURUSD rises, you don't know whether the euro strengthened, the dollar weakened, or both. So a performance list will often show you the same underlying story several times over, dressed as different pairs.
Reading forex results well means noticing that pattern. If five of your top seven gainers are USD pairs pointing the same direction, that's one fact about the dollar, not seven opportunities.
Volume is the other difference. There's no central exchange in forex, so there's no authoritative volume figure the way there is on an exchange-traded market. Screens here work on price: performance, structure, levels, and momentum. Session timing helps fill the gap. A move that happened during the London overlap means something different from one that happened in the quiet hours.
For pair selection and how to read correlated results, see the guide to screening forex pairs.
Crypto
Crypto never closes, which sounds convenient but creates a subtle problem: there's no daily close to measure against. The "daily" candle is a convention, usually midnight UTC, and it carries no real meaning the way an equity market's close does. Treat daily performance figures as a rolling window rather than a meaningful boundary.
The range of normal is also much wider. A move that would be huge in forex is routine here. This is where running the same screen across several timeframes earns its keep. A token up 12 percent on the day but flat over the week is a different situation from one up 12 percent on the day and 40 percent on the week, and only the multi-timeframe view separates them.
RSI is particularly useful in crypto for the same reason. Because it measures an instrument against its own recent range rather than against a fixed threshold, it handles the enormous spread of volatility between large and small tokens better than a raw percentage figure does.
Indices
Indices are the most orderly of the five. They move less than crypto, trend more cleanly than forex, and their sessions are well defined, which makes them a good place to learn what a screen's output actually looks like before applying it somewhere noisier.
The thing to watch is correlation. Global indices move together far more than the other asset classes do, particularly during risk-on and risk-off stretches. A screen showing eight indices breaking out simultaneously is usually reporting one macro event, not eight independent setups.
Because moves are smaller, thresholds that work in crypto will return nothing here. Expect to loosen settings when you switch to this market.
Commodities
Commodities carry an expiry date, and that causes a specific problem. Contracts roll, and when they do, the price series can jump for reasons unrelated to the market. A performance or breakout screen can flag a rollover as a real move. It's worth knowing roughly when the contracts you follow roll, so you can recognise the pattern when it appears.
Seasonality matters here more than elsewhere. Natural gas before winter, crops around planting and harvest. A move that looks notable on its own may be completely normal for the time of year. A screen doesn't know that. You do, and it belongs in how you read the output.
These markets also react sharply to scheduled news: inventory reports, weather, supply disruptions. Screening right after a release gives very different results from screening between them.
Metals
Gold and silver sit awkwardly among commodities. They trade partly like commodities and partly like macro instruments, responding to dollar strength, interest rates, and risk sentiment more than to physical supply.
In practice that means metals often move with currencies rather than with energy or agriculture. If gold tops your metals performance list on a day the dollar sold off, those two facts are the same fact.
Industrial metals like copper behave more conventionally, tracking manufacturing demand and the broader growth picture. When you read a metals screen, it's worth mentally separating the precious names from the industrial ones, because a single ranked list mixes two different sets of drivers.
Building Your First Screen
Here's a complete screen using the five components and the simplest useful condition there is.
The question: which instruments moved the most in the last four hours?
Market. Pick one, not several. Use the asset class you actually trade, because the goal here isn't coverage, it's learning what the output looks like when you already recognise most of the instruments coming back.
Screen type. Performance. One condition, nothing layered on top. A simple screen shows you the real spread of moves in your market, which is information a tightly tuned one hides.
Timeframe. Four hours. Long enough that a single candle's noise washes out, short enough to still be current. Then run the same screen at 1h and D. You'll get three different leaderboards, and where they disagree tells you which moves are sustained and which were one spike.
Settings. Leave them at default. You don't yet know what threshold you care about, and changing settings before you've seen normal output means you're guessing.
Output. Ranked by size of change. Read the top five, then switch to the losers view and read those too. That side isn't a throwaway. It's the strongest downside momentum in your market, and traders who only ever read the gainers spend years accidentally screening for long setups only.
Run this daily for a week before changing anything. You're building a sense of what normal looks like. Once you have it, switching to a breakouts screen or tightening the settings actually means something, because you'll know what changed.
Five Screening Mistakes
Setting thresholds too tight. Strict settings feel rigorous and often return nothing at all. When that happens the instinct is to assume nothing's going on. Usually the screen is just too demanding. Loosen it until results appear, then tighten gradually.
Using too short a timeframe. A 15-minute screen returns something every time you look, and almost none of it matters. Short timeframes manufacture the feeling of opportunity. If you're refreshing constantly and trading more than planned, check this first.
Treating a result as a signal. A screen gives you candidates, not decisions. The instrument at the top of your performance list has already moved, which is a reason to look at the chart and not a reason to enter.
Reading only one timeframe. A single view tells you what happened recently. Comparing several tells you whether it's building or fading, and that distinction is most of the value.
Using one set of expectations across every market. Three percent means nothing in crypto and a lot in indices. When you switch markets, expect to adjust what counts as significant.
From Screen Result to Trade
A screen is a discovery tool. Its only job is to turn a large market into a short list. Everything after that is still yours.
The workflow: the screen returns candidates, you review the charts properly, you discard most of them, you check the survivors against your own entry criteria, you size the position and set your risk, then you execute wherever you execute.
Notice how little of that is screening. A good screen turns four hundred instruments into eight worth a look, which saves an enormous amount of time. It doesn't tell you which to trade, when to enter, or how much to risk. Anything claiming otherwise is making a promise about the future that nothing can keep.
Frequently Asked Questions
What's the difference between a screener and a scanner? In practice, nothing. The words are used interchangeably. Where a distinction is made, scanning suggests continuous monitoring and screening suggests a filter run on demand.
Can I use the same settings for forex and crypto? Not usefully. Typical ranges differ enough that a threshold meaningful in one is either trivial or unreachable in the other. Adjust when you switch markets.
How often should I run a screen? Match it to your timeframe. Daily candles, once a day. Four-hour candles, at candle close. Checking far more often than your timeframe just adds noise.
Why don't forex screens use volume? Because there's no central exchange in forex, there's no authoritative volume figure to screen on. Price-based conditions work fine without it, and session timing often does the job volume would elsewhere.
What timeframe is best for screening? The one you trade on. The common mistake is screening much shorter than you hold, which surfaces moves that are over before you can act.
Is a screen result a trading signal? No. It's a candidate that met your condition. Every result still needs review before it becomes a trade.
Do I need to know how to code? No. Point-and-click screening covers most of what traders need. A query language and API exist for people who want to automate, but they're optional.
Getting Started
You can run the performance screen described above right now on XCREENER, across forex, crypto, indices, commodities, and metals, with no signup required.
If you already know your market, the specific guides go deeper: forex screening