How to Trade Like a Turtle in 2026: A Step-by-Step Guide Using XCREENER
In our last article The Turtle Trading Strategy, we told the story of the Turtle Traders, the group of complete beginners who learned a simple rulebook in two weeks and made over $100 million. (If you haven't read it yet, start there, and this guide will make much more sense.)
The good news: the Turtle rules are public, and they're simple. The original Turtles had to track dozens of markets by hand, on paper, every single day. Today, a screener can do that scanning for you in seconds.
In this guide, we'll walk through how to replicate the Turtle system step by step using XCREENER, a web-based market screening tool that detects breakouts and breakdowns across crypto, forex, indices, commodities, and metals. It works in any browser, on desktop or mobile.
Quick recap of the Turtle rules: Buy when price breaks above its recent high (a breakout). Sell short when it breaks below its recent low (a breakdown). Risk only a small fixed percentage per trade. Cut losers fast. Ride winners until the trend reverses. That's it. The rest is discipline.
What You'll Need
- XCREENER: open xcreener.com in your browser. It finds the breakouts and shows you each instrument's ATR (volatility): everything the system needs.
- A broker or exchange: wherever you trade forex, commodities, indices, metals, or crypto.
Step 1: Pick Your Market
On the left side of XCREENER, you'll see the asset classes: Crypto, Forex, Indices, Commodities, and Metals.
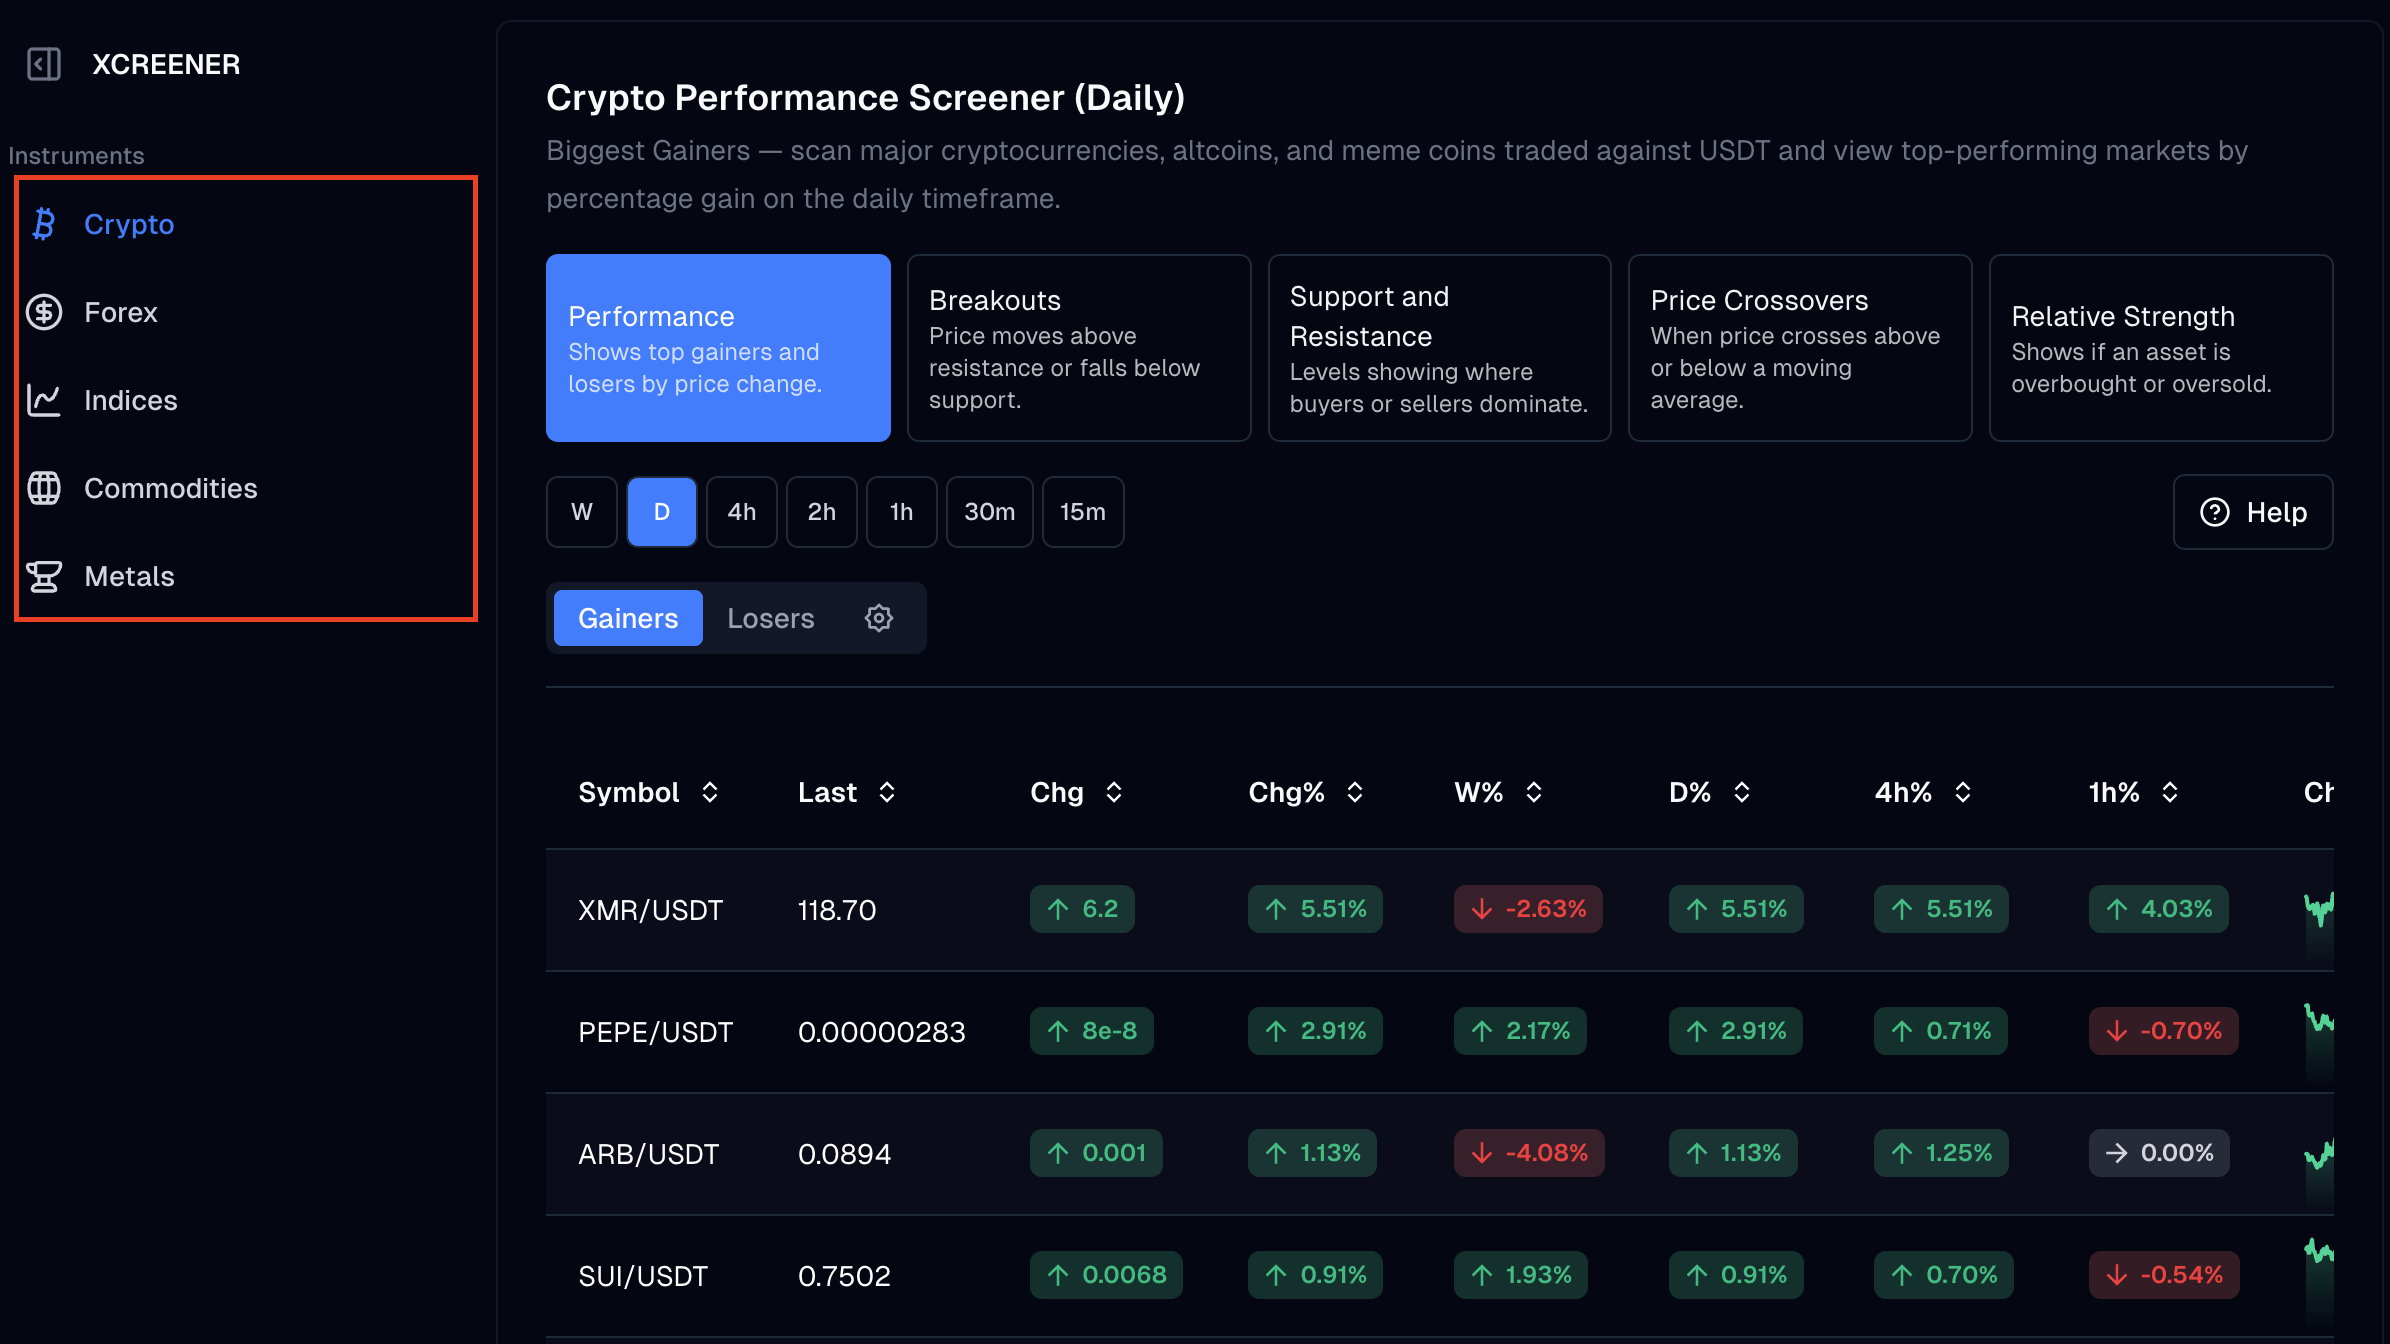
The original Turtles traded a diversified basket (currencies, bonds, oil, metals, coffee, sugar) and that diversification was a core part of the system. To stay true to it, don't just watch one market. A few notes on each:
- Forex, commodities, metals, and indices are the closest to what the Turtles actually traded. These markets tend to produce longer, smoother trends, which is exactly what this system is built to catch.
- Crypto is popular and it certainly trends, but be warned: crypto is far more volatile than anything the Turtles ever traded. Moves that take months in forex can happen in days (in both directions). If you scan crypto, position sizing and stop-losses (Steps 4 and 5) are not optional: they're survival. More on this in the crypto section below.
A good starting habit: check two or three asset classes daily, not just one.
Step 2: Set Up System 1 (the 20-Day Breakout)
The Turtles' first system entered when price broke above its highest high of the last 20 days (or below its lowest low, for shorts).
Here's how to set that up:
- Open your chosen market (say, Commodities) and click the Breakouts tab at the top, the one described as "Price moves above resistance or falls below support."
- Select the D (Daily) timeframe. The Turtles worked strictly off daily prices, so this is the setting that matches the original system. (XCREENER also offers weekly and intraday timeframes down to 15m; more on those later.)
- Click the gear icon next to the Breakouts/Breakdowns toggle to open Settings.
- Under Breakout Settings → Period Length, enter 20.
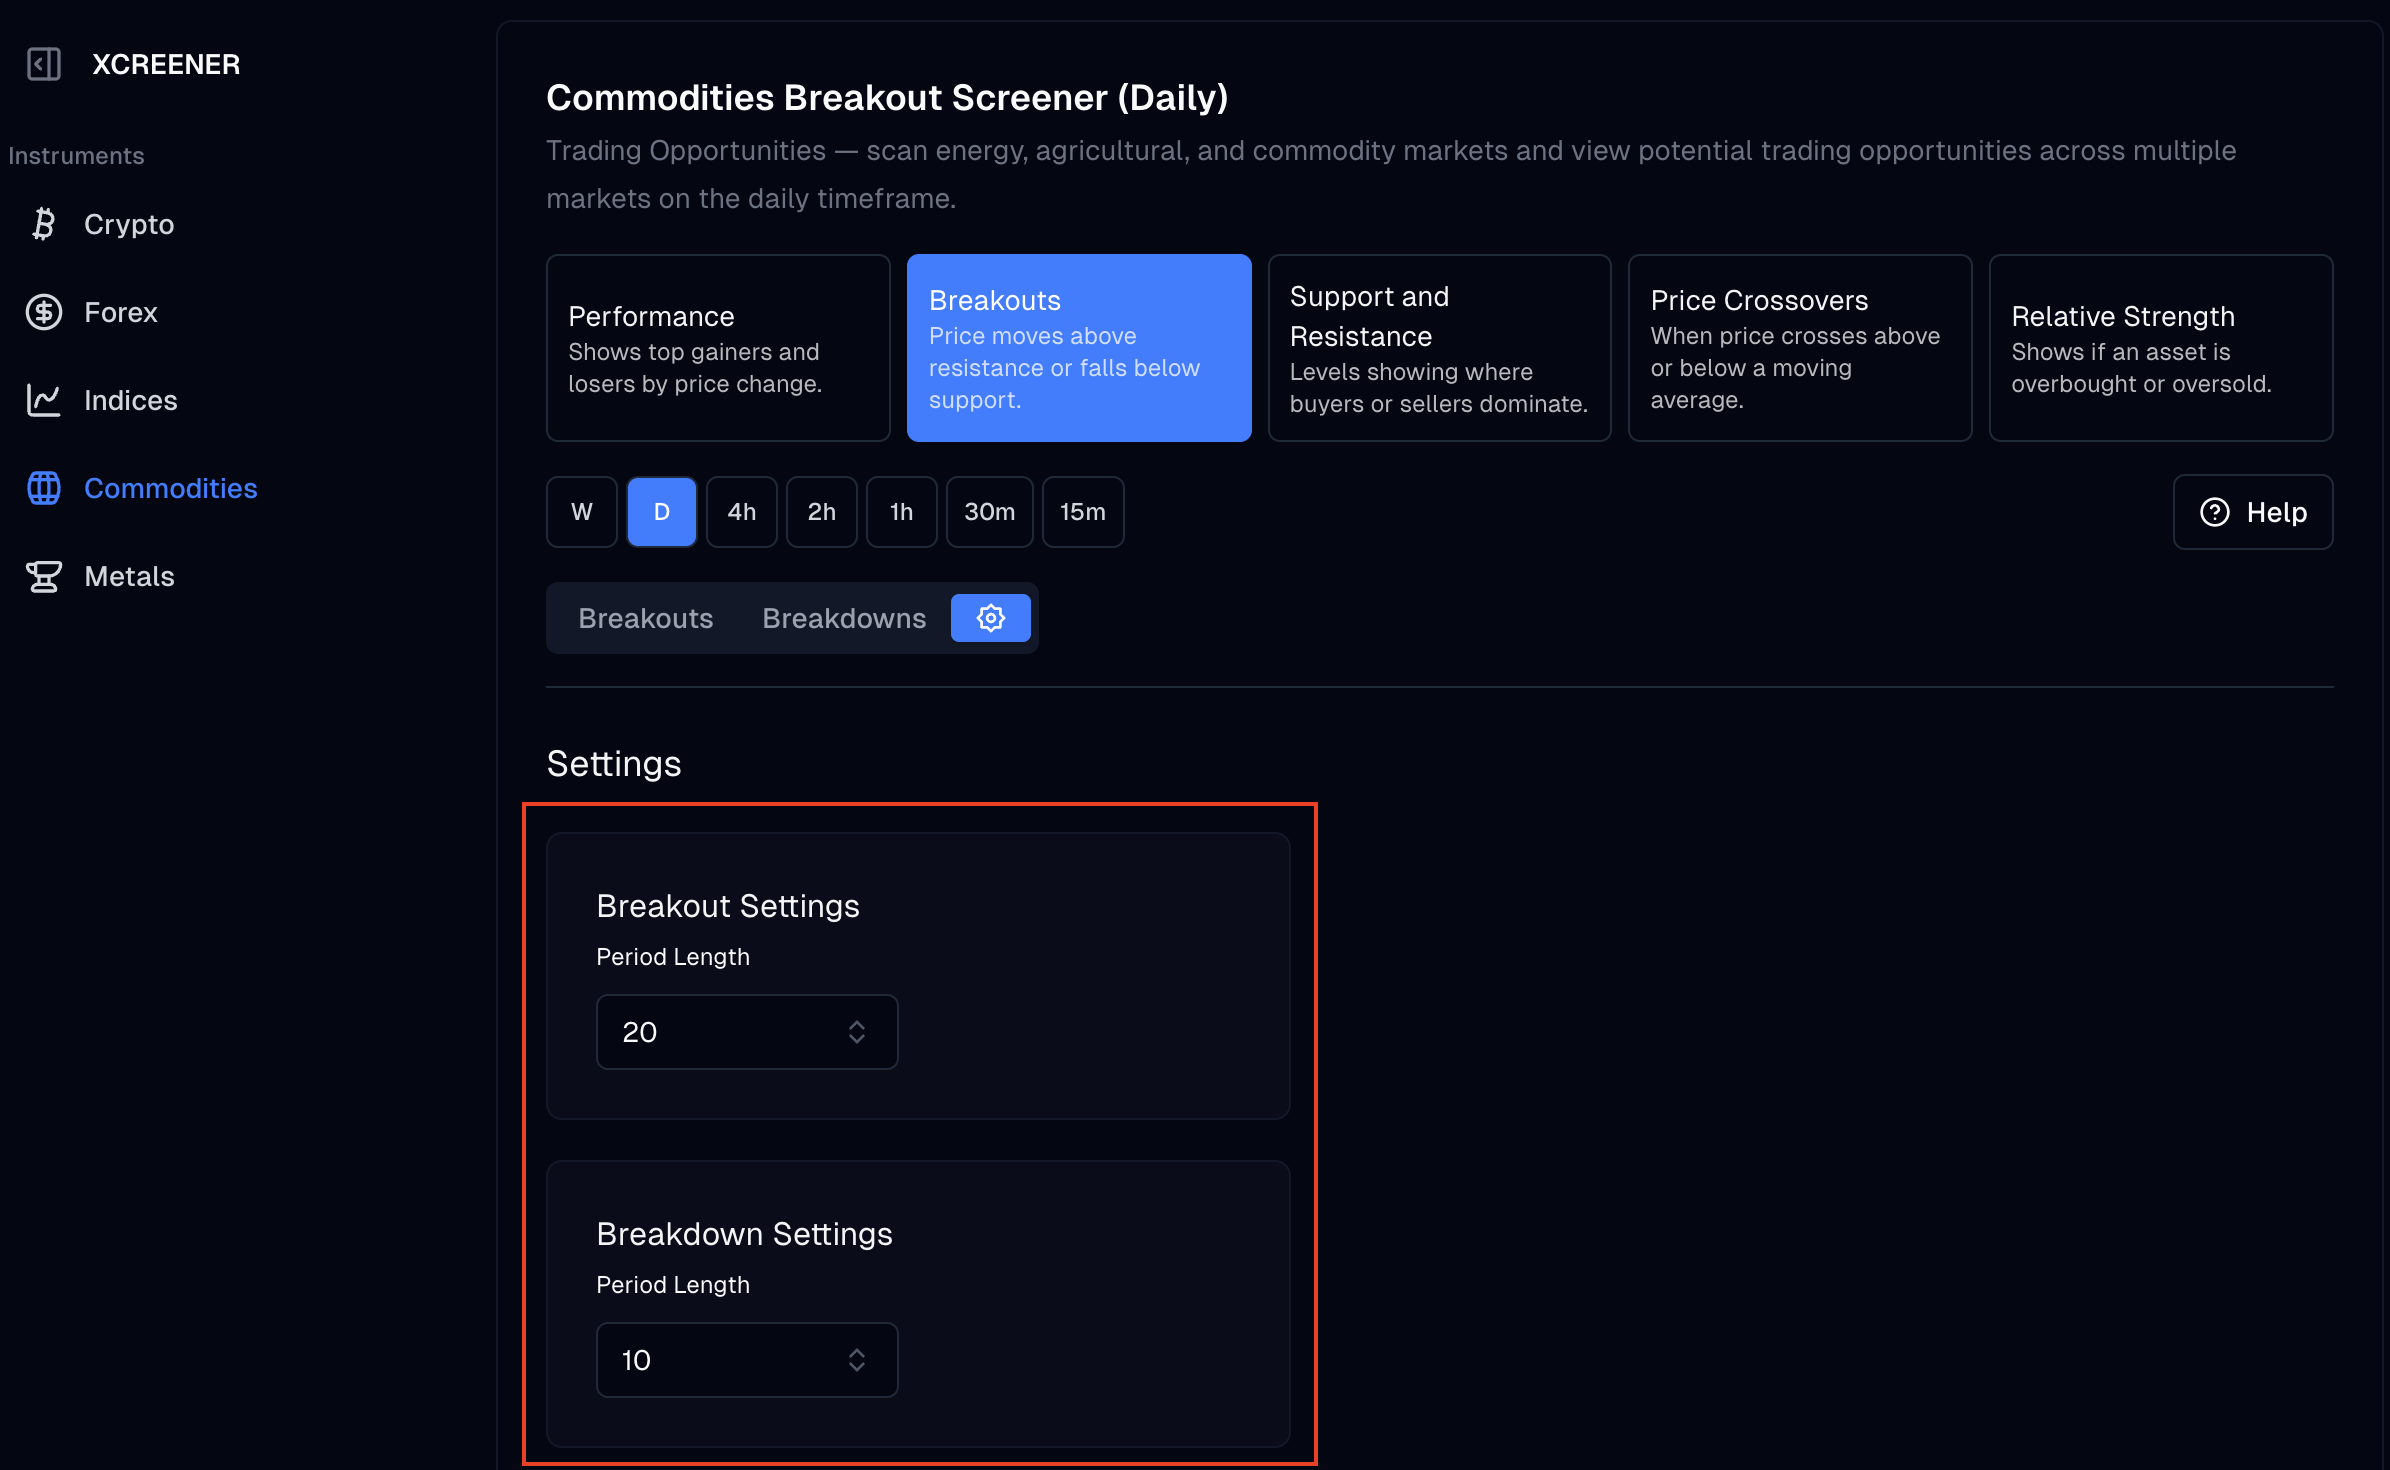
That's it. The screener will now list every instrument in that market currently trading above its 20-day high, in other words, every live System 1 buy signal.
Step 3: Read the Screener
Back on the Breakouts screen, each row is an instrument that's breaking out right now:
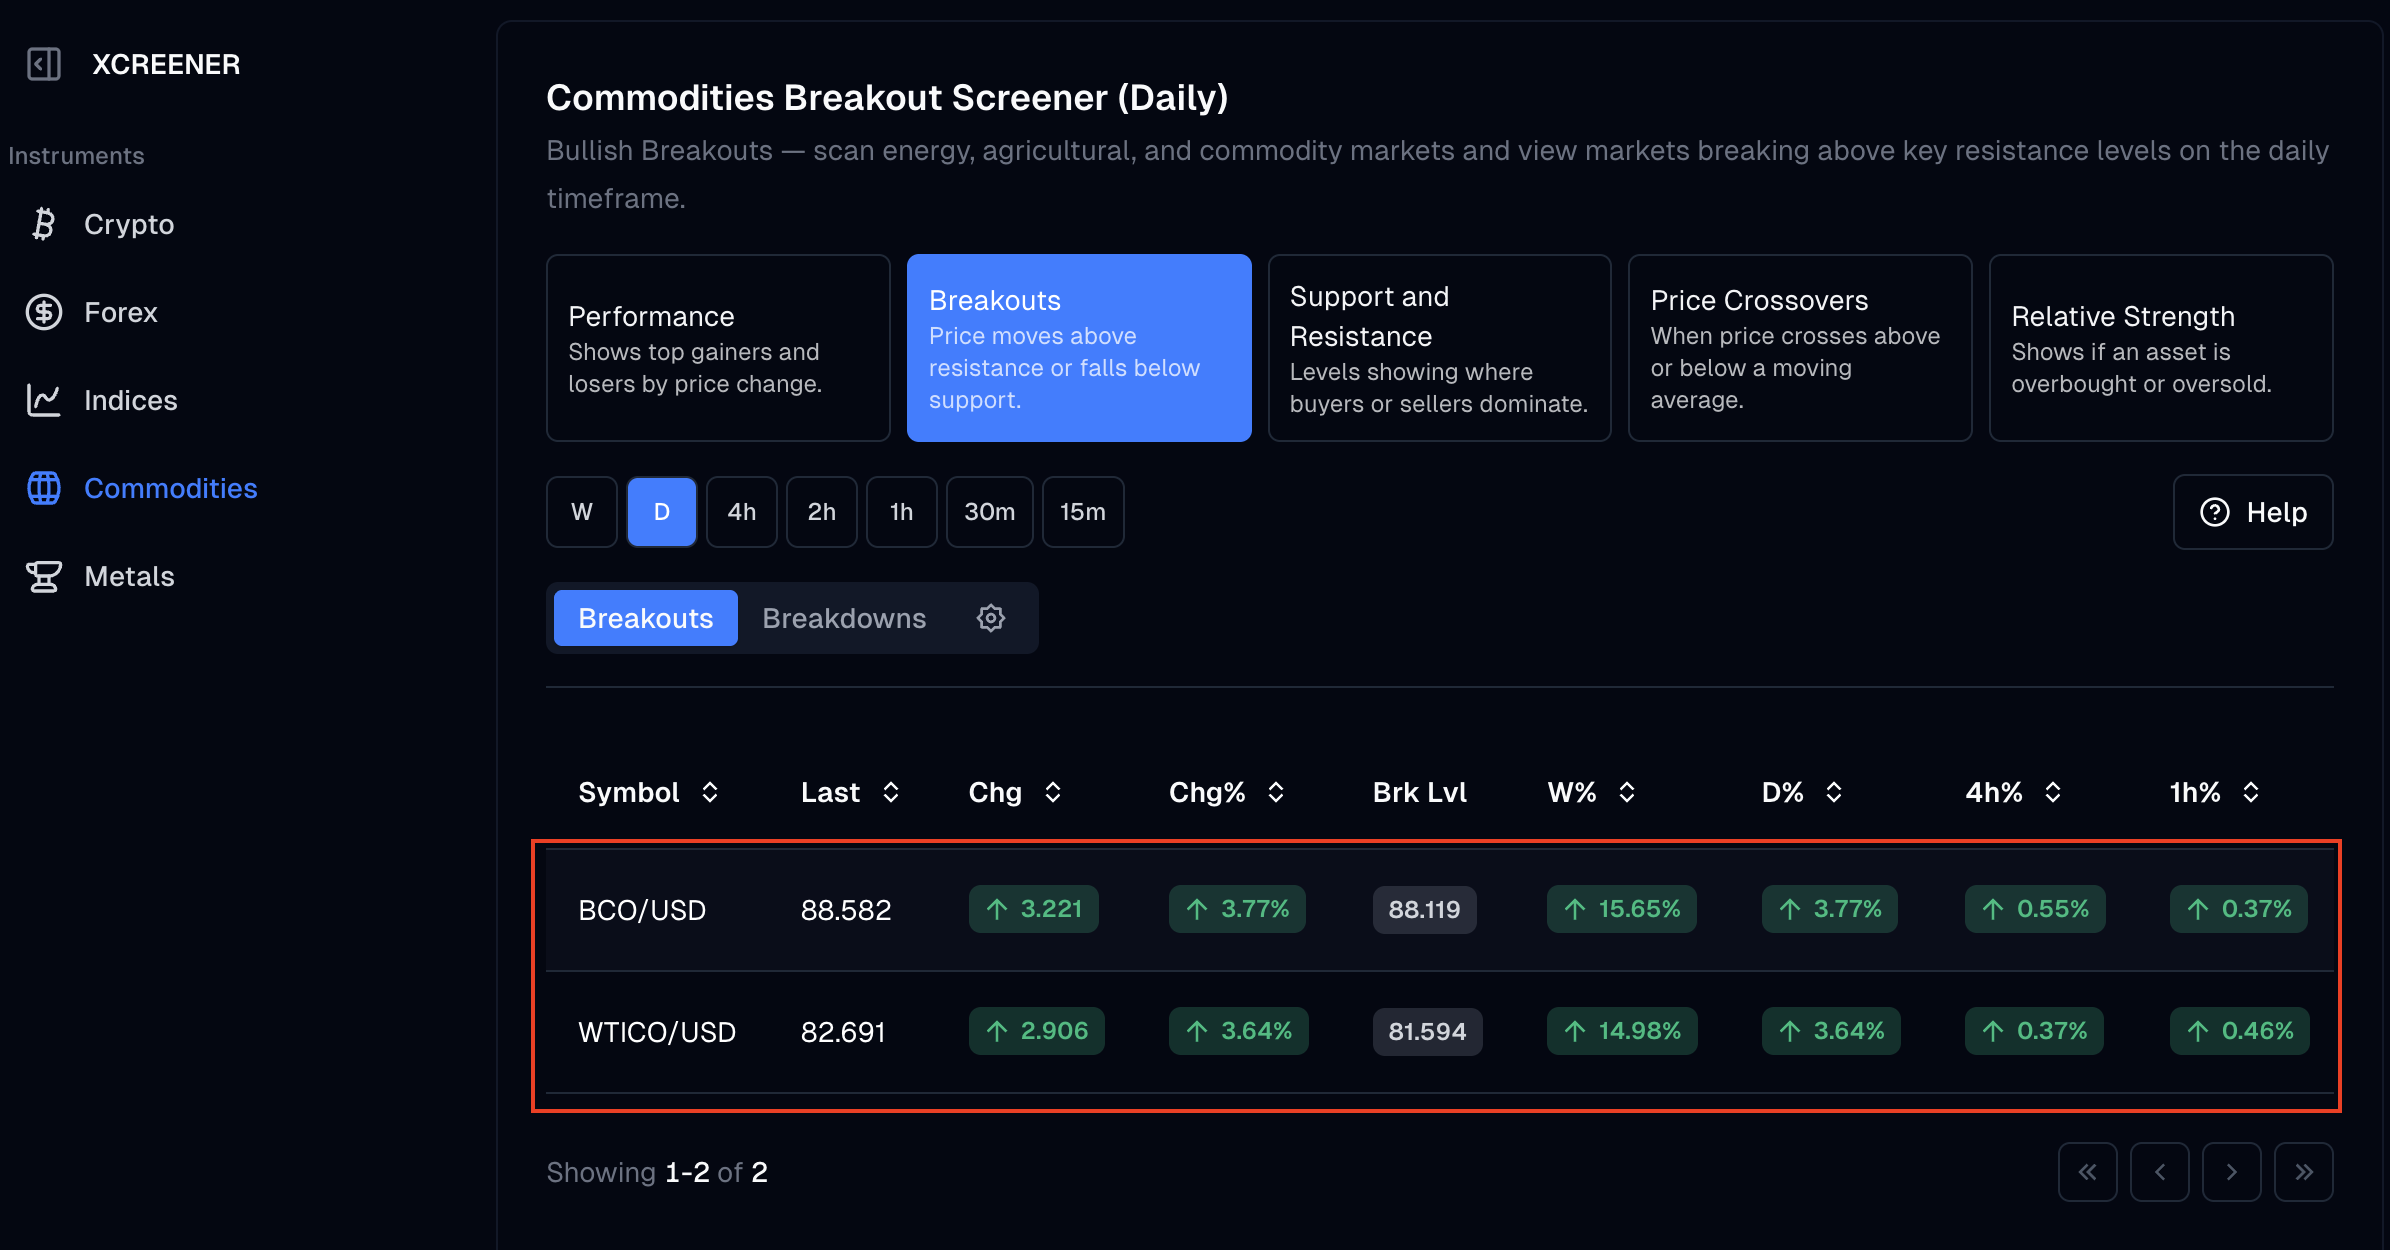
Here's what the columns mean:
- Symbol: the instrument (e.g., WTICO/USD is West Texas Oil).
- Last: the current price.
- Brk Lvl: the breakout level, the old 20-day high that price just cleared. This number matters: it's your reference point for the trade.
- Chg / Chg% / W% / D% / 4h% / 1h%: how much price has moved recently, so you can see the strength of the move at a glance.
- Chart: a mini sparkline of recent price action.
In the example above, West Texas Oil (WTICO/USD) is trading at 82.691 after clearing its breakout level of 81.594, a live long signal under System 1 rules.
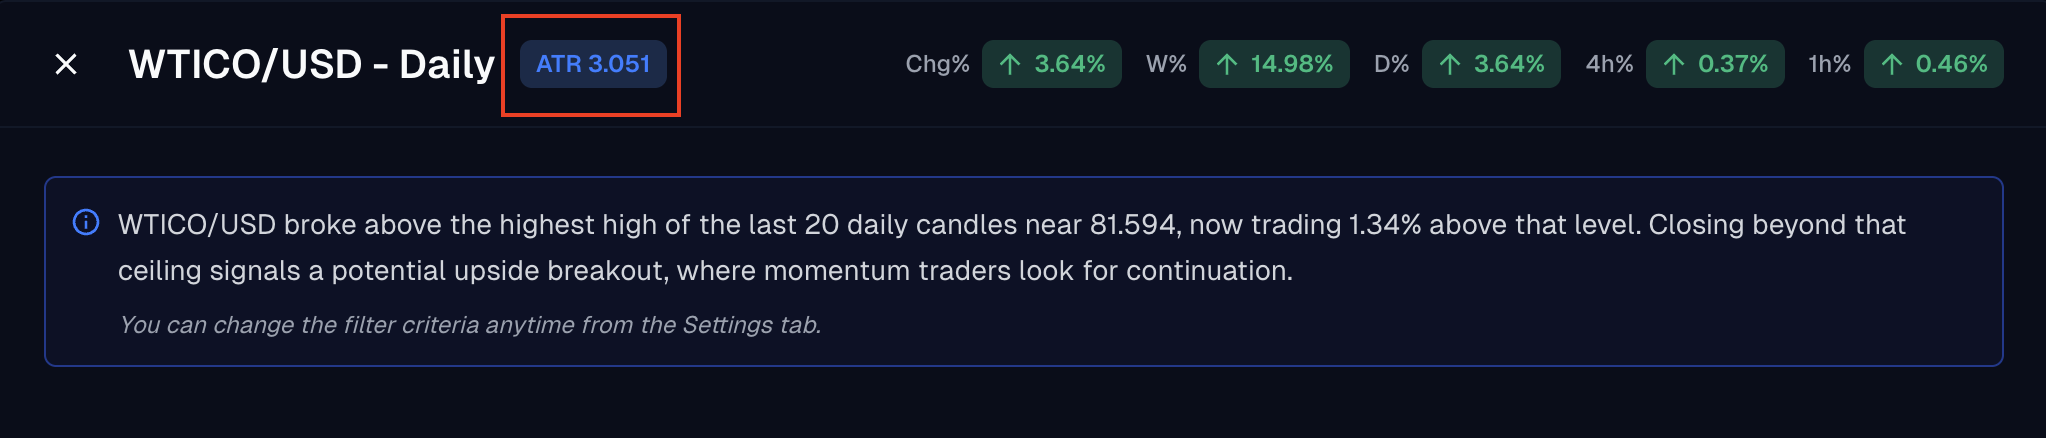
Click any row to see the breakout on a chart. This opens a full candlestick chart with the breakout level marked as a dashed "Brk Lvl" line, plus a plain-English summary of what just happened, for example: WTI crude broke above the highest high of the last 20 daily candles near 81.594, and is now trading 1.34% above that level. Right next to the symbol name, you'll also see a blue ATR badge: hold onto that number, because it's the key to Step 4.
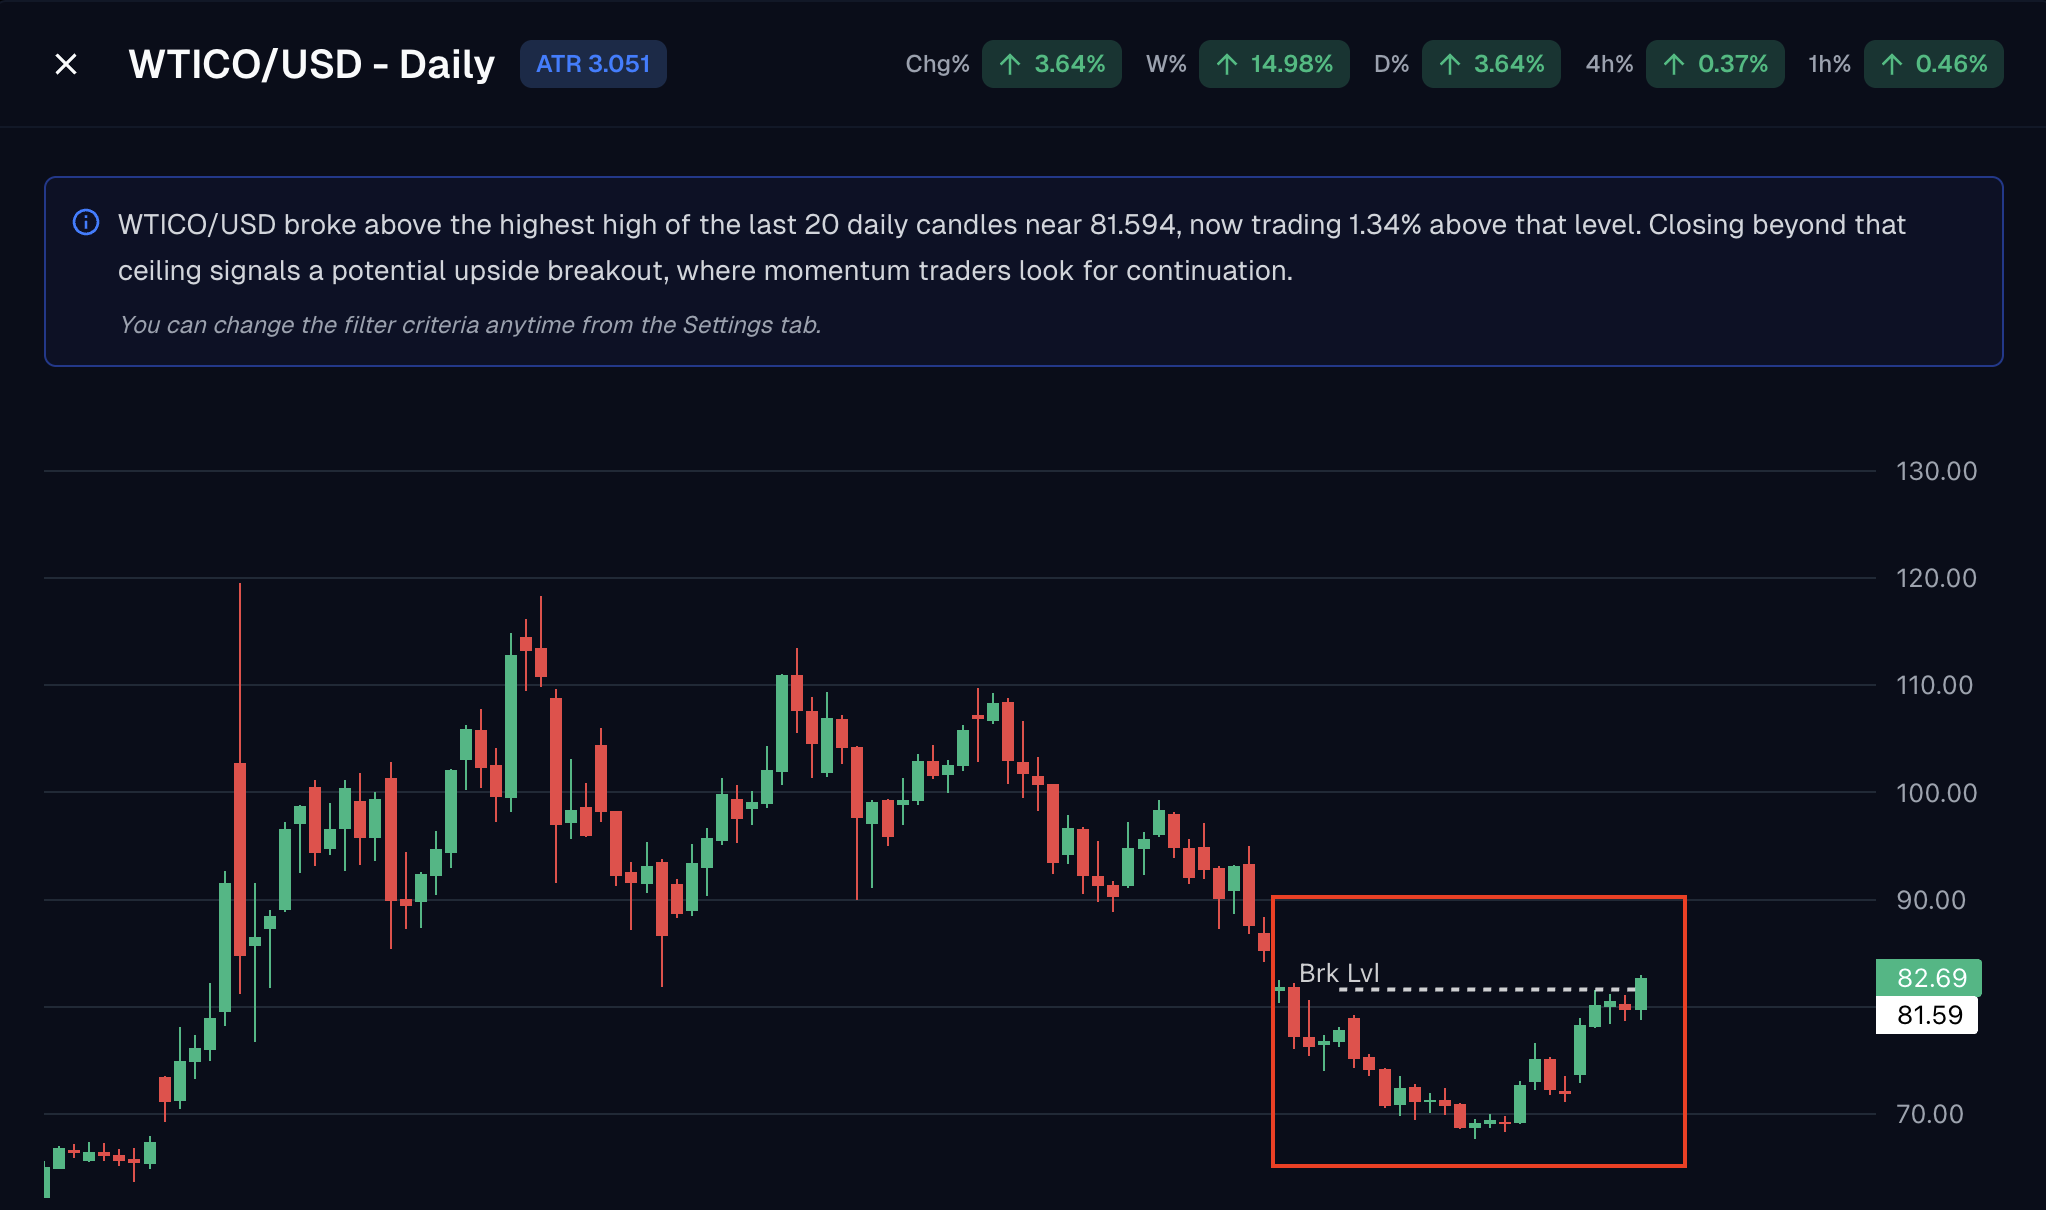
Take ten seconds here before you do anything else: this chart view is your sanity check. Two things to look for:
- Context. Is this breakout emerging from a long decline (a potential trend reversal, like the WTI chart above, which broke out after months of falling prices) or is it a continuation of an existing uptrend? Both are valid Turtle entries, but seeing the bigger picture stops you from being surprised later.
- How far past the level price is. The percentage above the breakout level is shown right in the summary. A price barely poking above the line is an earlier, cleaner entry; one already stretched far beyond it means you're late: your stop (Step 5) will still be measured from your entry, so a late entry quietly worsens your risk-reward.
For short trades, click the Breakdowns toggle instead. It lists instruments breaking below their recent lows, the Turtle sell-short signals. Don't be surprised if it's sometimes empty:
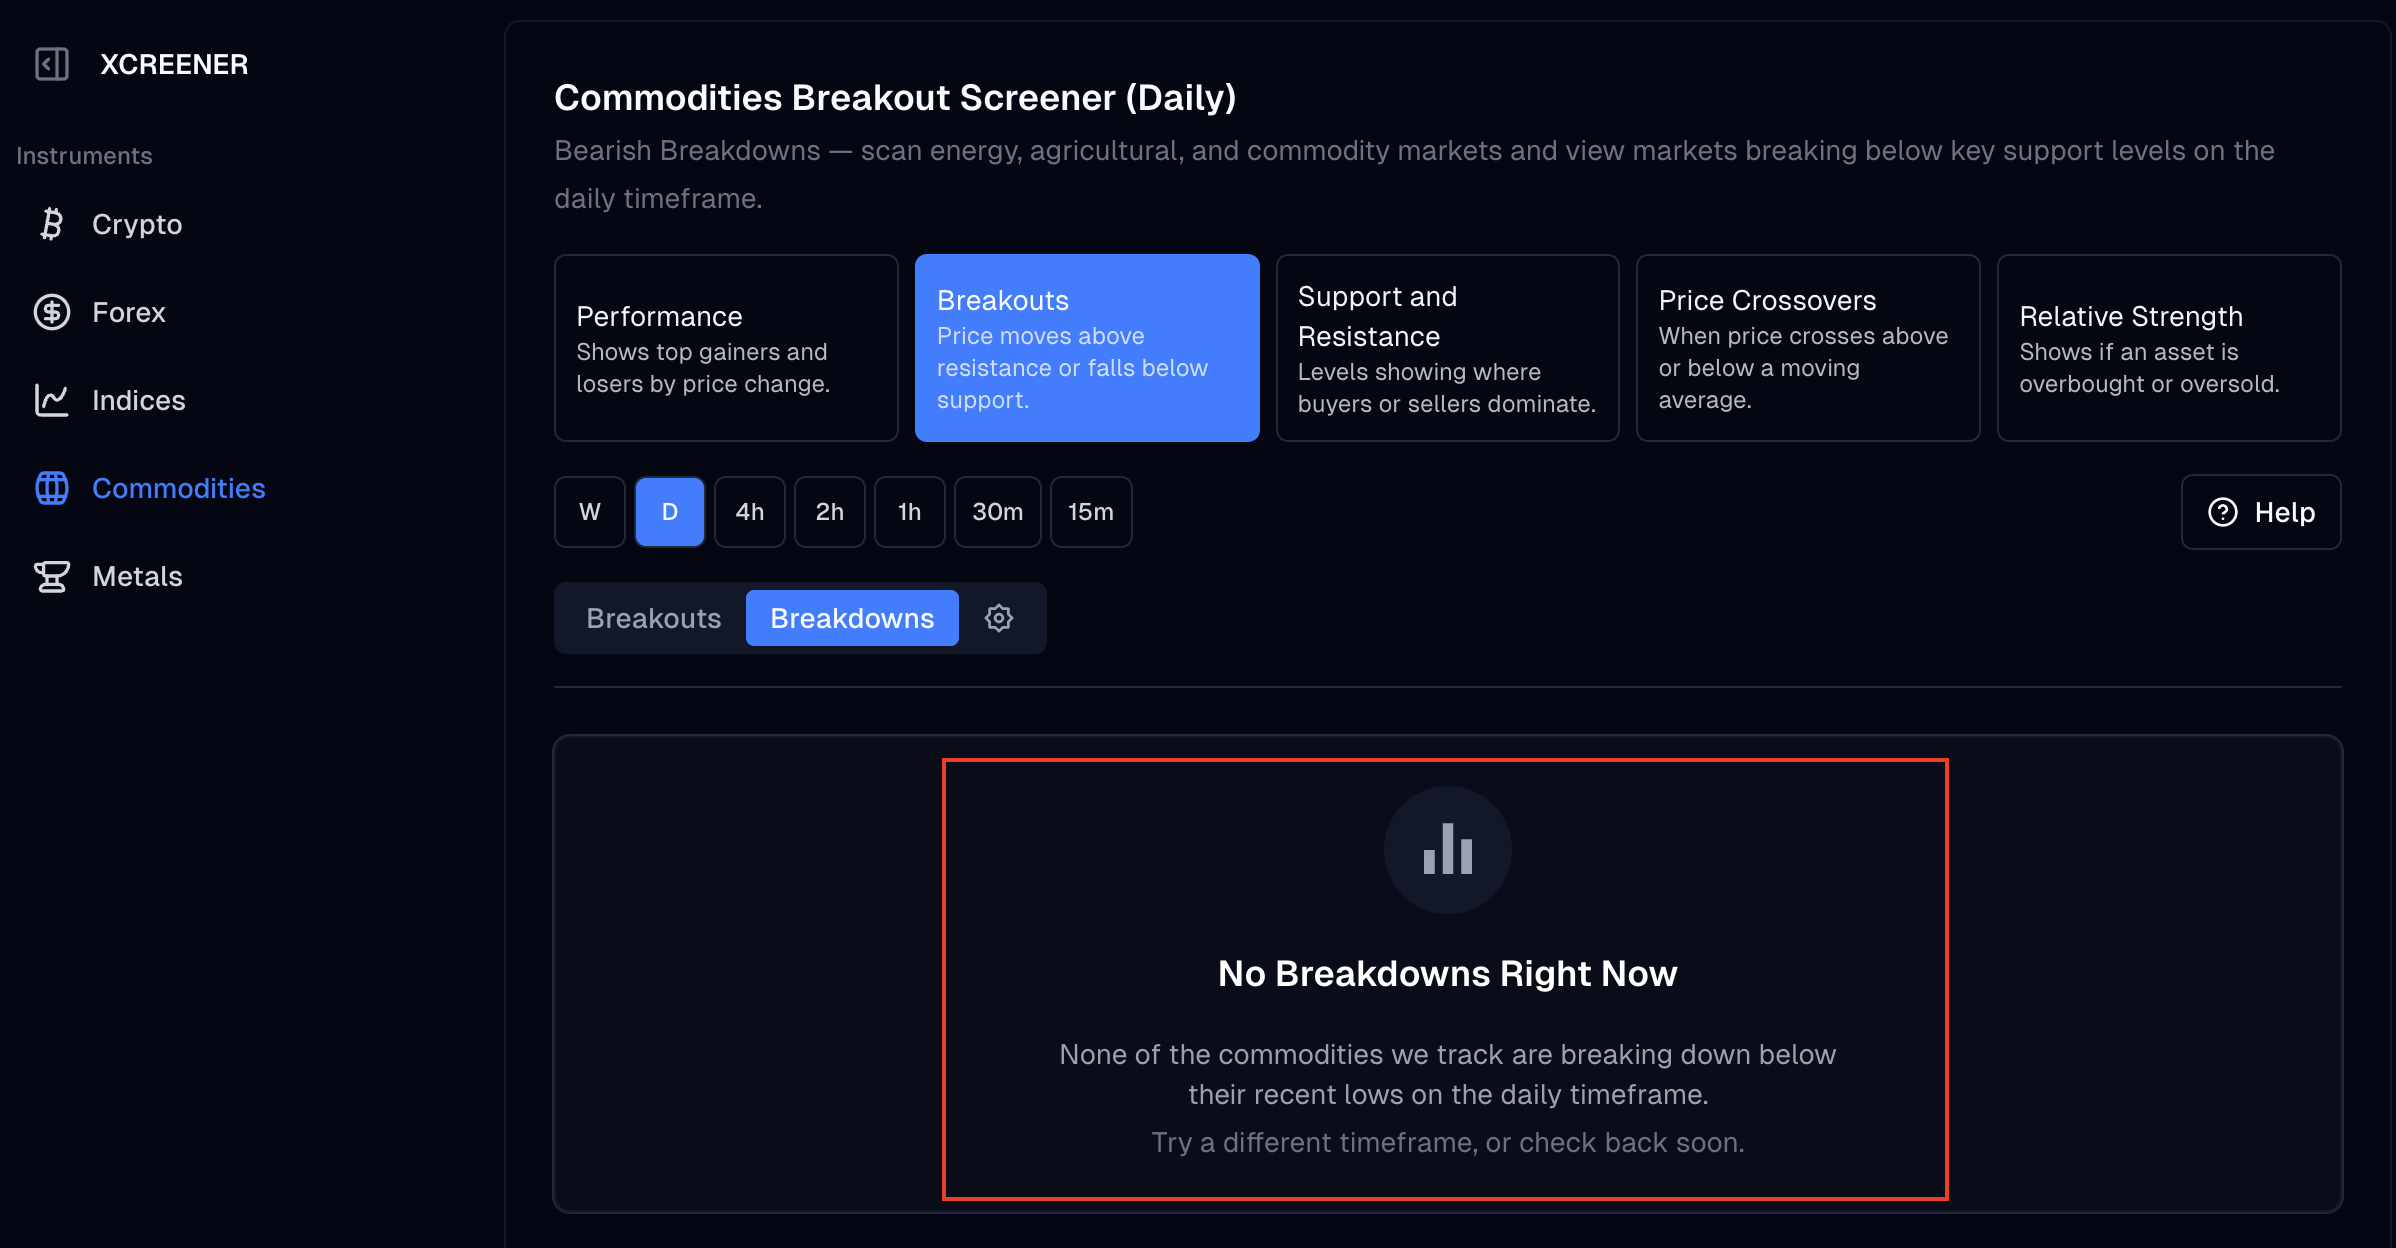
An empty screen is information too. It means nothing in that market is making a bearish break, so the system says: no trade. One of the hardest Turtle skills was doing nothing when there was no signal.
Step 4: Size Your Position Before You Enter
This is the step most people skip, and it's the step that kept the Turtles alive. Their rule: risk no more than about 2% of your account on any single trade, and trade smaller in more volatile markets.
The number that makes this work is the ATR (Average True Range), the market's average daily movement. The Turtles called it N, their unit of volatility. You don't need to calculate anything: open the instrument's chart view in XCREENER and read it straight off the ATR badge next to the symbol name.
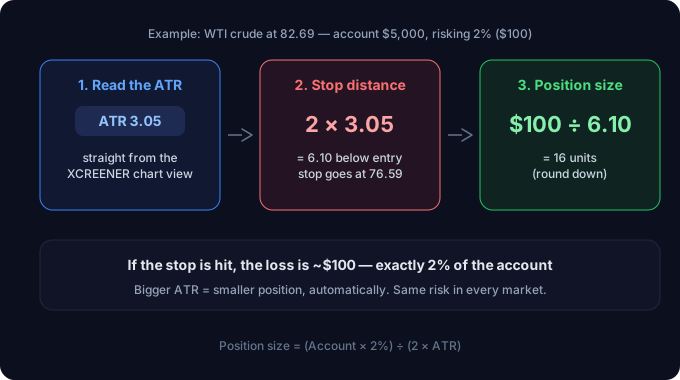
Now the math, using the WTI crude example from the chart above:
- Account size: $5,000
- Risk per trade (2%): $100
- Entry price: 82.69, ATR (N) from the badge: 3.05
- Stop distance = 2 × N = 6.10 (the Turtle stop is always 2 ATRs from entry)
- Position size = Risk ÷ Stop distance = $100 ÷ 6.10 ≈ 16 units (round down)
If the trade fails and hits your stop, you lose about $100 (2% of the account) and you live to take the next signal. Notice what this formula does automatically: the wilder the market, the smaller your position. A volatile crypto with a huge ATR gets a tiny position; a calm forex pair gets a bigger one. Same risk either way. That's the Turtle secret in one equation.
Step 5: Enter the Trade and Set Your Stop Immediately
Once the screener shows a breakout and you've sized the position:
- Enter as soon as the level is broken; don't wait for the daily close. This is exactly what the original Turtles did: the moment price ticked through the 20-day high, they were in. You can use XCREENER the same way: keep it on the Daily timeframe, and it will detect breakouts as they happen during the trading day. When an instrument appears on the list, the level has been broken and the signal is live.
- Place your stop-loss the moment you enter, at 2N from your entry price. In the WTI example: 82.69 − 6.10 = 76.59.
- Never move the stop further away. Not once. Not "just this time." Every Turtle rule bends before this one does.
One trade-off to know, because the Turtles lived it too: entering intraday gets you the earliest, best price on real trends, but some intraday breaks fall back below the level by the close, a false breakout. That's not a flaw in your execution; it's a known cost of the system, and it's precisely what the 2N stop is there to handle.
The Turtles also pyramided: added to positions as trends ran. As a beginner, skip that for now. One clean entry, one stop, one exit is the version to master first. (Advanced readers: the original rule was to add a unit every ½N of favorable movement, up to 4 units.)
Step 6: Know Your Exit (the Screener Works in Reverse)
The Turtles exited winning long trades when price fell back below its 10-day low. Here's a trick: that exit signal is itself just a breakdown, so XCREENER's Breakdowns tab can be your exit screener.
- In Settings → Breakdown Settings, set Period Length to 10.
- Each day, glance at the Breakdowns list. If an instrument you're long shows up there, that's your exit signal: close the trade.
- If you're short, it's mirrored: set the Breakout period to 10, and exit when your instrument appears on the Breakouts list.
One safety habit for exits: the Breakdowns list shows the strongest signals, and on a day when many instruments are breaking down at once, a symbol you hold might not be among the ones displayed. So don't rely on the list alone for exits. For any open position, also click into its chart on XCREENER (or your broker) and check where price sits relative to its recent 10-day low. The Breakdowns list is your early-warning radar; the chart check is your confirmation.
Two things to expect, because they surprise everyone:
- You will give back profit at the end of every trend. The trade peaks, then retraces to the 10-day low before you exit. That giveback is the fee you pay for catching the whole trend instead of a small piece of it.
- Most trades will be losers. The original system lost roughly 6–7 trades out of 10. The profits came from a few big winners. If you need to be right often to feel good, trend following will break you: the system is profitable, but it's not comfortable.
Optional: Running System 2 (the 55-Day Breakout)
Once you're comfortable, you can add the Turtles' slower system:
- Entry: set the Breakout Period Length to 55. Signals are rarer, but they catch only the biggest, most established trends.
- Exit: use a 20-day breakdown (instead of 10); the slower system gives trends more room to breathe.
Since XCREENER uses one period setting at a time, the simplest workflow is to pick one system and stick with it, or do what many traders do: check the 55-period scan once a week for major signals, and run the 20-period scan as your daily routine.
Your Daily Routine (10 Minutes, a Few Times a Day)
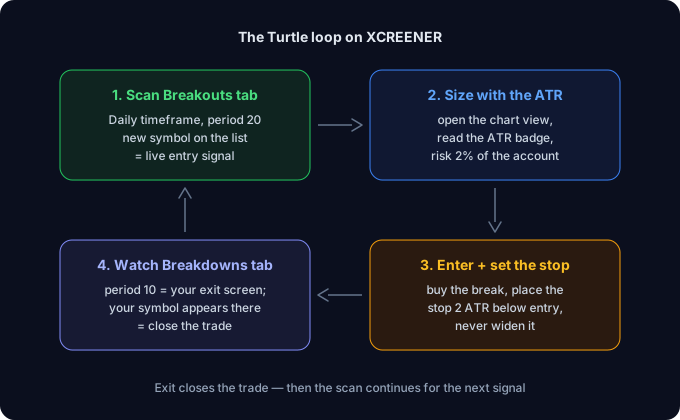
Treat XCREENER like the Turtles treated their price sheets, a short, regular check-in. The original Turtles entered the moment a level broke, so instead of one end-of-day review, glance at the screener a few times during the trading day:
- Open xcreener.com, morning, midday, and before the daily close works well.
- Check Breakouts in your chosen markets (Daily timeframe) → any new entry signals? XCREENER detects breakouts intraday, so a new name on the list means the level was just broken. Click into the chart view to see the Brk Lvl and the trend context.
- Check Breakdowns (set to your exit period) → any exit signals for open trades?
- For new signals: open the chart view, read the ATR badge, size the position, enter, set the stop.
- Close the tab between check-ins. No signal, no trade. Staring at charts between checks is how rules get broken.
A Special Warning on Crypto
Crypto deserves its own section because it's where beginners get hurt the most:
- Volatility cuts both ways. A 20-day breakout in Bitcoin can run 50%, or reverse 20% in a weekend. The ATR-based sizing in Step 4 will naturally give you small crypto positions. Trust it. If your position feels exciting, it's too big.
- Crypto trades 24/7. There's no daily close where the market sleeps, and price can blow through your stop overnight. Use actual stop orders on your exchange, not mental stops.
- Avoid leverage entirely while learning this system. The Turtles used futures leverage with strict rules and years of oversight. You don't need leverage for this system to work.
- Fast markets, more whipsaws. Expect more failed breakouts in crypto than in forex or commodities. This is why the longer-trending markets (currencies, commodities, metals, indices) are the friendlier place to learn.
Common Mistakes to Avoid
- Skipping the position sizing math. The breakout is the easy part; the sizing is the system.
- Cherry-picking signals. Taking only the breakouts that "feel right" destroys the edge. The Turtles took every valid signal precisely because nobody knows in advance which one becomes the monster winner.
- Using intraday timeframes too soon. XCREENER offers 15m–4h scans, but shorter timeframes mean more noise, more false breakouts, and more temptation. The original system was daily. Start there.
- Quitting during a losing streak. Losing streaks aren't a sign the system broke. They're a scheduled feature. The traders who failed with the Turtle rules were the ones who stopped following them.
Final Thoughts
The Turtle experiment proved that a written set of rules, followed with discipline, could turn beginners into profitable traders. The rules haven't changed, but the tools have. What took the Turtles hours of manual price-checking across dozens of markets now takes a ten-minute glance at a screener.
Set your period to 20, check the breakouts daily, size every trade small, honor every stop, and let the winners run. The system is simple. Following it is the hard part, and now you know that's exactly the point.
Try it yourself: open xcreener.com, set your breakout period to 20 on the Daily timeframe, and see which markets are breaking out right now.
Disclaimer: This article is for educational purposes only and is not financial or investment advice. Trading forex, commodities, indices, metals, and especially cryptocurrencies involves substantial risk of loss and is not suitable for every investor. Past performance (including the historical results of the Turtle Traders) does not guarantee future results. Never trade with money you cannot afford to lose.