The Turtle Trading Strategy: How a Bet Created a Generation of Traders
A Bit of History
The Turtle Trading experiment began in 1983 as the result of a friendly argument between two successful Chicago commodity traders, Richard Dennis and William Eckhardt. Dennis, who had famously turned a few thousand dollars into a fortune estimated at over $100 million, believed that great trading could be taught to almost anyone with a clear set of rules and the discipline to follow them. Eckhardt disagreed, arguing that successful traders possessed innate talent that couldn't simply be transferred.
To settle the debate, Dennis placed newspaper ads recruiting trainees with no trading experience required. From over a thousand applicants, he selected a small group, trained them for just two weeks, and gave them his own money to trade. He nicknamed them "Turtles," reportedly inspired by a turtle farm he had visited in Singapore, remarking that he could "grow traders just like they grow turtles."
The results settled the argument decisively in Dennis's favor. Over the following four to five years, the Turtles as a group reportedly earned aggregate profits of well over $100 million, with some individual Turtles compounding at 80-100% annually in their best years. Several went on to become renowned money managers in their own right, most notably Jerry Parker of Chesapeake Capital. The complete rules were eventually made public, largely through former Turtle Curtis Faith's book Way of the Turtle and Michael Covel's The Complete TurtleTrader.
What They Traded
The Turtles were trend followers, and trend following requires liquid markets that can absorb large positions and produce sustained directional moves. They traded futures contracts across a diversified basket of markets, including:
- Currencies - Swiss franc, Deutschmark, British pound, French franc, Japanese yen, Canadian dollar
- Interest rate instruments - Eurodollars, 90-day U.S. Treasury bills, 10-year Treasury notes, 30-year Treasury bonds
- Energy - Crude oil, heating oil, unleaded gas
- Metals - Gold, silver, copper
- Softs and agriculturals - Coffee, cocoa, sugar, cotton
- Index futures - S&P 500
Diversification was central to the system. Because trend followers lose money most of the time and profit from a few large moves, trading many uncorrelated markets increased the odds of always having exposure to whichever market was trending.
Timeframe
The Turtles were long-term position traders working off daily price data. They were not day traders or scalpers. Positions were held for weeks to months, riding trends for as long as the rules permitted. Orders were placed based on daily breakout levels, and the system required only end-of-day analysis plus intraday execution when breakout levels were hit. A single winning trade could last several months from entry to final exit.
How They Entered the Market
Entries were based on Donchian channel breakouts: buying when price exceeded the highest high of a lookback period, or selling short when price dropped below the lowest low. There were two systems:
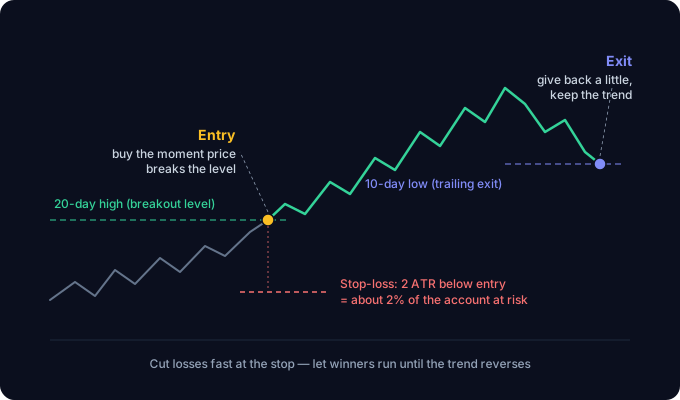
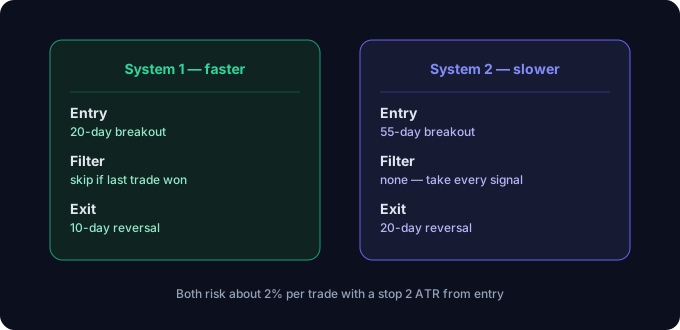
System 1 (shorter-term): Enter long on a breakout above the 20-day high, or short on a breakdown below the 20-day low. This entry came with a filter: the signal was skipped if the previous System 1 breakout in that market had been a winning trade. The logic was that winning breakouts tend not to cluster back-to-back. If the skipped trade would have been a winner and the market kept moving, a fail-safe 55-day breakout ensured the Turtles never missed a major trend entirely.
System 2 (longer-term): Enter long on a breakout above the 55-day high, or short below the 55-day low. All System 2 signals were taken, with no filter.
Pyramiding: The Turtles didn't enter their full position at once. They added units as the trade moved in their favor, typically adding one unit each time price moved half an ATR (they called it "N," the 20-day Average True Range) beyond the previous entry, up to a maximum of 4 units in a single market. This meant their largest positions were concentrated in their best-performing trades.
How They Exited Trades
There were two distinct exits, and both mattered enormously.
The stop-loss (cutting losers): Every position had a hard stop placed 2N (two ATRs) away from the entry price. Because of how position sizes were calculated, a 2N move against the position equaled a loss of roughly 2% of account equity per unit. When units were pyramided, stops on earlier units were moved up so the total position risk stayed controlled. Stops were honored without exception.
The trailing exit (letting winners run): Profitable trades were not closed at targets. In fact, there were no profit targets at all. Instead:
- System 1 positions exited when price hit a 10-day low (for longs) or 10-day high (for shorts).
- System 2 positions exited on a 20-day low (for longs) or 20-day high (for shorts).
This meant giving back a meaningful chunk of open profit at the end of every trend. Psychologically this was one of the hardest parts of the system, but it was the mechanism that allowed the occasional trade to grow into an enormous winner.
How Much They Risked
Risk management, not entry signals, was the true heart of the system.
- Volatility-based position sizing: Position size in every market was calculated so that 1N (one ATR) of price movement equaled 1% of account equity. Volatile markets got small positions; quiet markets got larger ones. This "unit" concept normalized risk across wildly different instruments.
- Roughly 2% risk per unit: With stops set at 2N, a stopped-out unit cost about 2% of equity.
- Position limits: A maximum of 4 units in any single market, 6 units in closely correlated markets, 10 units in loosely correlated markets, and 12 units total in any one direction (long or short).
- Drawdown rule: For every 10% drawdown in the account, the notional trading size was cut by 20%, and only restored as equity recovered. This aggressively slowed the bleed during losing streaks.
The Risks Involved
No honest article about the Turtles should skip this section, because trend following is brutally demanding:
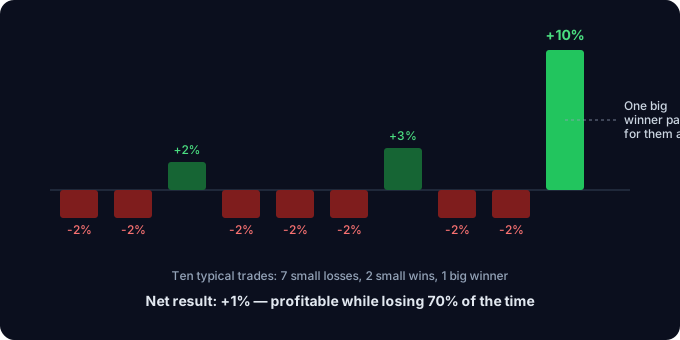
- Low win rate: The system lost on the majority of trades, often 60-70% of them. Profitability depended entirely on a handful of outsized winners covering many small losses. Long losing streaks were normal, not a sign of failure.
- Deep drawdowns: Even successful Turtles endured drawdowns of 30% or more. Anyone psychologically unable to keep taking signals through a losing streak would fail with the exact same rules.
- Whipsaw markets: In choppy, trendless conditions, breakouts repeatedly fail, generating a steady stream of small losses with nothing to offset them.
- Giving back open profits: The trailing exit routinely surrendered 20-50% of peak open profit before closing a trade. Watching large paper gains shrink tested discipline severely.
- Leverage and gap risk: Futures are leveraged instruments. Markets can gap through stops (limit moves in commodities were a real hazard), producing losses larger than planned.
- Regime change: A rules-based edge can decay. Markets today are faster and more crowded with systematic traders than in the 1980s, and the original parameters would likely need adaptation. Many Turtles who succeeded long-term evolved their systems over time.
The Criteria, Summarized
For quick reference, the complete decision framework came down to answering six questions mechanically, with zero discretion:
- What to trade: Liquid futures across diversified, ideally uncorrelated markets.
- How much to trade: Volatility-adjusted units where 1N of movement = 1% of equity; hard caps per market, per sector, and per direction.
- When to enter: 20-day breakout (with the last-trade-was-a-winner filter) or 55-day breakout, in the direction of the break.
- When to add: Pyramid an additional unit every ½N of favorable movement, up to 4 units.
- When to cut losses: Hard stop at 2N from entry. Always, no exceptions, no hoping.
- When to take profits: Trail out on a 10-day (System 1) or 20-day (System 2) reversal against the position.
The Real Lesson
The enduring insight of the Turtle experiment isn't the specific parameters (20 days versus 55 days matters far less than people think). It's that the Turtles all received identical rules, yet their results still varied, because the differentiator was discipline in execution. Dennis proved that a trading edge can be taught; the experiment also quietly proved Eckhardt half-right, because sticking to the rules through pain turned out to be the rarest skill of all.
Want to Trade Like a Turtle Today?
In 1983, following these rules meant tracking dozens of markets by hand, on paper, every single day. Today, a screener can do that scanning in seconds. We've written a complete step-by-step guide to replicating the Turtle system (20-day breakout scans, ATR-based position sizing, stops, and exits) using XCREENER, our breakout screener for forex, commodities, metals, indices, and crypto.
Read next: How to Trade the Turtle Strategy Step by Step
This article is for educational purposes only and is not investment advice. Futures trading involves substantial risk of loss and is not suitable for every investor.